
Fig. 4
- ID
- ZDB-FIG-200617-5
- Publication
- Navajas Acedo et al., 2019 - PCP and Wnt pathway components act in parallel during zebrafish mechanosensory hair cell orientation
- Other Figures
- All Figure Page
- Back to All Figure Page
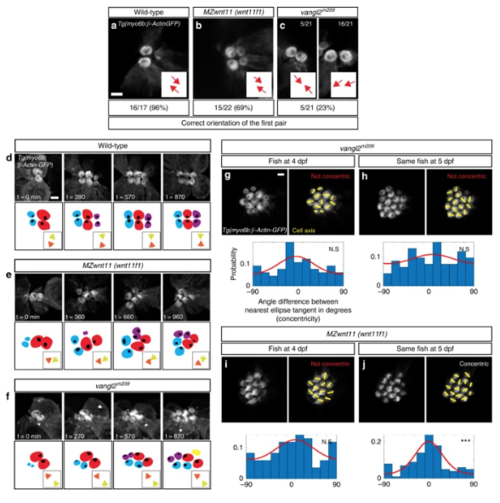
Differences in the appearance of the hair cell phenotypes in vangl2 and MZwnt11 (wnt11f1) mutants. a–c Orientation of the first pair of hair cells in primII-derived neuromasts of wild type (a), MZwnt11 (wnt11f1) mutants (b), and vangl2 mutants (c) labeled with Tg(myo6b:β-Actin-GFP). In c, the left panel shows the number of correctly oriented pairs, and the right panel shows the number of incorrectly oriented pairs (the majority). The percentages for each of the conditions represent the number of pairs that show correct hair cell orientation. d–f Hair cell orientation over time in wild type (n = 3 animals) (d), MZwnt11 (wnt11f1) mutants (n = 5) (e), and vangl2 mutants (n = 2) (f) labeled with Tg(myo6b:β-Actin-GFP). Each of the conditions is depicted using a color-coded cartoon, and the hair cell orientation of the first pair is represented by arrows in the box on the lower right. To differentiate between each hair cell of the pair, each of the arrows is in a different color. g–j Hair cell orientation of the same vangl2 mutant fish at 4 dpf (g) and 5 dpf (h), and the same MZwnt11 (wnt11f1) mutant embryo at 4 dpf (i) and 5 dpf (j) in a Tg(myo6b:β-Actin-GFP) transgenic background. The distribution of angles of each given hair cell with respect to the nearest ellipse tangent (concentricity) for primII-derived neuromasts of all the conditions tested is shown. Note that only the MZwnt11 (wnt11f1) mutants at 5 dpf (j) show significant concentricity (Uniform distribution p-values in g = 0.223, h = 0.469, i = 0.308, j = 1.97 × 10−07). The von Mises distribution is shown for visual display of the data distribution. Yellow lines represent the polarity axis for each hair cell. “Not Concentric” vs. “Concentric” labels in g–j were based on the statistical significance (n = 8 neuromasts for each condition). Scale bars in a, d, and g equal 2 μm |
| Fish: | |
|---|---|
| Observed In: | |
| Stage Range: | Day 4 to Day 5 |