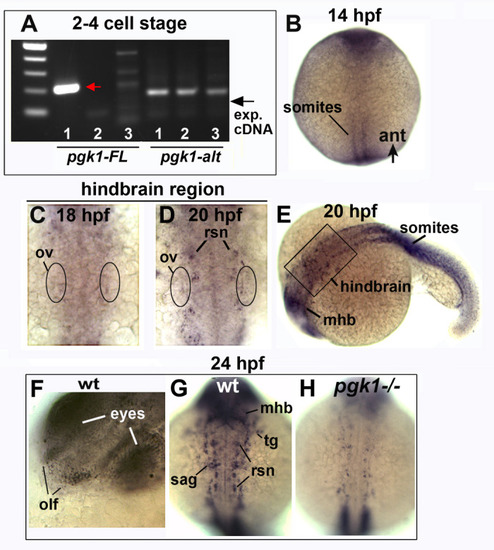
(A) RT-PCR for pgk1-FL and pgk1-alt conducted on mRNA harvested at the 2–4 cell stage (lane 1), mRNA samples excluding reverse transcriptase (lane 2), or genomic DNA (lane 3). The expected 211 bp amplicon was obtained for pgk1-FL (red arrow), but not the 163 bp amplicon (exp. cDNA) for pgk1-alt (black arrow). (B–H) Whole mount in situ hybridization for pgk1-FL at the indicated times. Images show dorsal views with anterior to the top (B–D, G,H) or lateral views with anterior to the left (E, F). Expression of pgk1-FL shows the first signs of upregulation in developing somites at 14 hpf (B), whereas diffuse upregulation becomes evident in the hindbrain region beginning at 18 hpf (C) and becomes more intense in developing reticulospinal neurons (rsn) by 20 hpf (D). The position of the otic vesicle (ov) is indicated. The specimen in (D) is depicted at lower magnification in (E) and shows that expression of pgk1-FL also increases in the midbrain-hindbrain border (mhb) and somites. (F–H) Expression of pgk1-FL at 24 hpf in wild-type embryos (F, G) and a pgk1- / - mutant (H). In wild-type embryos local upregulation increases near sites of Fgf expression, including the olfactory epithelium (olf), SAG, midbrain-hindbrain border (mhb), the trigeminal ganglion (tg) and reticulospinal neurons (rsn). Expression is strongly reduced in pgk1- / - mutants.