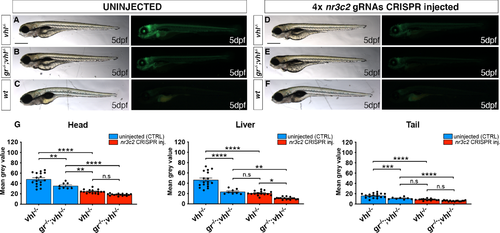
Both Gr and Mr are directly required in the HIF signalling pathway. A-F. Representative pictures of 5 dpf CRISPANT mutants created by redundantly targeting nr3c2 (mr) gene via co-injection of 4x gRNAs in gr+/-;vhl+/-(phd3:eGFP) x gr-/-; vhl+/-(phd3:eGFP) derived embryos (n = 344). Uninjected embryos were used as control (n = 170). Fluorescence, exposure = 991,4 ms. Scale bar 500 μm. G. Statistical analysis performed on mean grey value quantification (at the level of the head, liver and tail), after phenotypic analysis, on 5 dpf mr 4x gRNAs injected and uninjected larvae. vhl-/- uninjected n = 17 larvae: head 48.28 ± 2.99 (mean ± s.e.m); liver 46.47 ± 3.55 (mean ± s.e.m); tail 16.15 ± 1.06 (mean ± s.e.m). gr-/-;vhl-/- uninjected n = 8 larvae: head 35.48 ± 2.03 (mean ± s.e.m); liver 23.56 ± 1.72 (mean ± s.e.m); tail 10.98 ± 0.75 (mean ± s.e.m). vhl-/- injected n = 15 larvae: head 24.62 ± 0.97 (mean ± s.e.m); liver 20.67 ± 1.1 (mean ± s.e.m); tail 8.57 ± 0.39 (mean ± s.e.m). gr-/-;vhl-/- injected n = 16 larvae: head 18.33 ± 0.46 (mean ± s.e.m); liver 10.71 ± 0.56 (mean ± s.e.m); tail 6.07 ± 0.26 (mean ± s.e.m); ordinary One-way ANOVA followed by Sidak’s multiple comparison test.
|
