
Fig. 2
- ID
- ZDB-FIG-200506-12
- Publication
- Aramaki et al., 2018 - Method for disarranging the pigment pattern of zebrafish by optogenetics
- Other Figures
- All Figure Page
- Back to All Figure Page
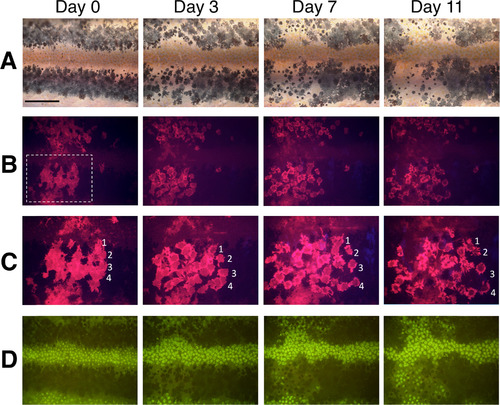
BL stimulation activates melanophore migration in vivo. (A–D) Serial images showing sequential changes in the pigment pattern of mitfa;ChR2(C128S/D156A) F0 transgenic fish during ongoing BL irradiation. Fish were reared in the dark until 5 wpf and then exposed to BL. (A) Bright-field images of melanophore stripes with ChR2(C128S/D156A)-mCherry transgene expression. (B) Red fluorescence images showing the shape of transgenic melanophores in the left half of the lower black stripe, highlighted with a white dashed box. (C) Magnified images of the area in the dashed square shown in panel B. Four different melanophores are indicated as 1–4. (D) Xanthophores were visible under green autofluorescence. Scale bar, 500 µm. Magnified and detailed images of Fig. 2 are shown in Supplementary Fig. S3. |
Reprinted from Developmental Biology, 460(1), Aramaki, T., Kondo, S., Method for disarranging the pigment pattern of zebrafish by optogenetics, 12-19, Copyright (2018) with permission from Elsevier. Full text @ Dev. Biol.