|
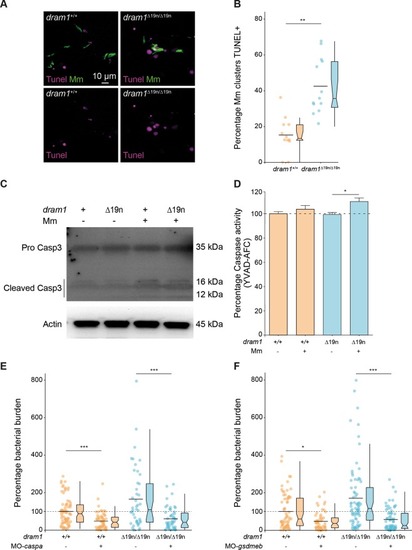
Dram1 deficiency results in increased pyroptotic cell death.a Representative confocal images of TUNEL staining in dram1∆19n/∆19n and dram1+/+ larvae at 2 dpi. The entire CHT region of fixed 2 dpi dram1∆19n/∆19n and dram1+/+ larvae was imaged. Scale bars, 10 μm. b Quantification of the percentage of Mm clusters positive for TUNEL staining (TUNEL+) in dram1∆19n/∆19n and dram1+/+ larvae. The percentage of Mm clusters TUNEL+ in the CHT region was determined per individual infected larva (≥12 larvae/group). Data are accumulated from two independent experiments and represented by scatter and boxplots as detailed in the “Methods” section. ns non-significant,*p < 0.05,**p < 0.01,***p < 0.001. c Detection of pro-Caspase 3 and cleaved Caspase 3 protein in dram1∆19n/∆19n and dram1+/+ embryos. Protein samples were extracted from 4 dpf infected and uninfected dram1∆19n/∆19n and dram1+/+ larvae (>10 larvae/sample). The Western blots were probed with antibodies against Caspase 3 and Actin as a loading control. Data is representative of two independent experiments. d Detection of Caspase activity (YVAD-AFC) in dram1∆19n/∆19n and dram1+/+embryos. Protein samples were obtained from 2 dpf control and infected dram1∆19n/∆19n and dram1+/+ embryos in GFP-Lc3 background (35 embryos/sample). The data is accumulated from two independent experiments (n = 4 samples/condition). e Mm bacterial burden at 2 dpi following knockdown of caspa in dram1∆19n/∆19n and dram1+/+ embryos. The data is accumulated from two independent experiments (>44 larvae/group) and represented by scatter and box plots as detailed in the “Methods” section. ns non-significant, *p < 0.05,**p < 0.01,***p < 0.001. f Mm bacterial burden at 2 dpi following knockdown of gsmdeb in dram1∆19n/∆19n and dram1+/+ embryos. The data is accumulated from two independent experiments (>56 larvae/group) and represented by scatter and box plots as detailed in the “Methods” section. ns non-significant, *p < 0.05,**p < 0.01,***p < 0.001 to mutated dram1.
|