|
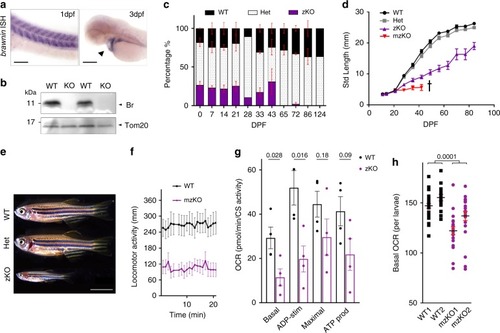
Knockout of <italic>Br</italic> in zebrafish causes lethal mitochondrial deficiency.a In-situ hybridization (ISH) of brawnin (br) in zebrafish larvae. dpf = days post fertilization. Left panel: scale = 100 µm, right panel: scale 200 µm. b Western blot analysis of purified mitochondria from adult WT and KO (homozygous br∆/br∆) skeletal muscle using zebrafish-specific α-Br. c Mendelian percentages of offspring from heterozygous (Het) intercrosses genotyped at the indicated dpf. Data represent the mean of at least 2 clutches per time point (except 28 and 124 dpf) with at least 15 animals per clutch. Error bars indicate SEM. d Standard length (mm) measurements of WT, Het, and zygotic KO (zKO) larvae generated from an F2 intercross genotyped and segregated at 3 dpf. Maternal zygotic KOs (mzKOs) were generated from a homozygous incross and measured until 42 dpf when all animals succumbed to disease. Data are representative of four independent experiments from two independent Cas9/gRNA injected br∆ KO allele founders. Number of animals at the beginning of the experiment: WT = 14; HET = 37; zKO = 8; mzKO = 22. Error bars indicate SEM. e Representative images of WT, Het, and zKO clutch-mates at 65 dpf. Scale = 5 mM. f Basal motility monitoring continuous swim tracking of WT and mzKO larvae at 11 dpf. 23 animals per genotype monitored. Error bars indicate SEM. g Coupled respiratory analysis of isolated SKM mitochondria measured on Agilent Seahorse in the presence of succinate + rotenone, read out as CS-normalized OCR. Basal, ADP stimulated, maximal respiration and ATP production were plotted. Data represent mean and SEM of four biological replicates. p-values from two-sided paired t-test. h Basal respiratory rate of free moving 1 dpf WT and mzKO larvae measured on Agilent Seahorse platform. Number of animals: WT1 = 30; WT2 = 15; KO1 = 21; KO2 = 23. Data represent mean and SEM, p-values from two-sided unpaired t-test.
|