
Fig. 4-S4
- ID
- ZDB-FIG-200327-17
- Publication
- Ye et al., 2019 - High fat diet induces microbiota-dependent silencing of enteroendocrine cells
- Other Figures
- All Figure Page
- Back to All Figure Page
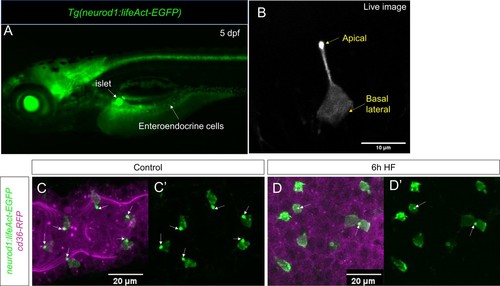
Characterization of Tg(neurod1:lifeAct-EGFP).( A) Epifluoresence image of 5 dpf Tg(neurod1:lifeAct-EGFP). The pancreatic islet and enteroendocrine cells that were labeled by lifeAct-EGFP are designated by white arrows. ( B) Confocal image of EEC labeled by Tg(neurod1:lifeAct-EGFP) in live zebrafish mounted in 2% low melting agarose. The stronger lifeAct-EGFP signal was detected in the apical of EEC protrusion. ( C, C’) Confocal image of Tg(neurod1:lifeAct-EGFP); TgBAC(cd36-RFP) zebrafish intestine. The EEC’s apical protrusion that labeled by a strong lifeAct-EGFP signal is labeled with white arrows. ( D, D’) Confocal images of Tg(neurod1:lifeAct-EGFP); TgBAC(cd36-RFP)zebrafish intestine after 6 hr high fat (HF) meal feeding. The EECs’ apical protrusion labeled by strong lifeAct-EGFP signal was reduced. |