
Fig. 2
- ID
- ZDB-FIG-200318-31
- Publication
- Schwayer et al., 2019 - Mechanosensation of Tight Junctions Depends on ZO-1 Phase Separation and Flow
- Other Figures
- All Figure Page
- Back to All Figure Page
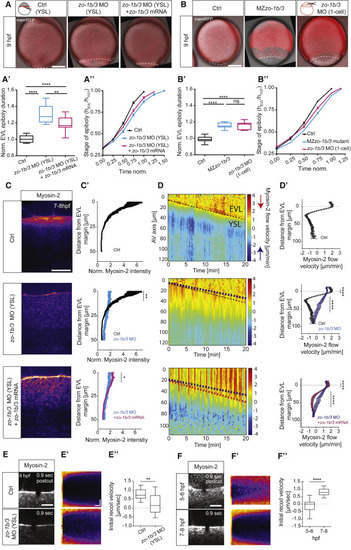
ZO-1b and 3 Are Required for Proper EVL Epiboly Movements and Actomyosin Flows and Tension within the YSL (A and B) MIPs of bright-field/fluorescence images of embryos injected directly into the YSL at 3.3 hpf with phenol red and H2A-mcherry mRNA as control (Ctrl), zo-1b and zo-3 MOs, and zo-1b/3 MOs together with GFP-tagged zo-1b and zo-3 mRNA (mutated for the MO recognition site) at 9 hpf (A) and wild-type control embryos (Ctrl) and MZzo-1b/3 mutant and 1-cell zo-1b/3 morphant embryos at 9 hpf (B). The plasma membrane is marked by membrane-RFP (red fluorescent protein) to outline cells. The EVL-YSL boundary is marked by a white dashed line to demarcate the extent of EVL epiboly under the different conditions. Schemes of different injection methods show injection into the YSL (A) to obtain YSL-specific knockdown and into the 1-cell stage embryo (B) to gain ubiquitous knockdown. Scale bar, 200 μm. (A’ and B’) Plot of the total time required for EVL to complete epiboly for the conditions shown in (A) and (B) and normalized to the average time needed by Ctrl embryos. (A’) YSL-Ctrl with N = 3, n = 11; YSL-morphant with N = 3, n = 12; YSL morphant rescue with N = 3, n = 11. (B’) Wild-type (WT) Ctrl with N = 4, n = 11; 1-cell stage injected Ctrl for morphant with N = 3, n = 11; mutant with N = 4, n = 13; 1-cell morphant with N = 3, n = 8. Data are shown as box-and-whisker plots (whiskers, Tukey); one-way ANOVA with Tukey’s multiple comparisons test. (A’’ and B’’) Plot of EVL tissue spreading, expressed as height of EVL (hEVL) normalized to total embryo height (hTOT) as a function of time normalized to the average time needed by Ctrl embryos for the conditions shown in (A) and (B). N/n as in (A’) and (B’). Data are mean ±SEM. (C) MIPs of Myosin-2 localization at the EVL-YSL boundary in Tg(actb1:myl12.1-eGFP) or Tg(actb1:myl12.1-mcherry) YSL-Ctrl (phenol red injected), zo-1b/3 YSL-morphant, and zo-1b/3 YSL-morphant embryos rescued by co-injection of GFP-tagged zo-1b and zo-3 (mutated for the MO recognition site) mRNAs at 7–8 hpf. Scale bar, 20 μm. (C’) Plot of Myosin-2 intensity as a function of distance from the EVL margin in YSL-Ctrl, zo-1b/3 YSL-morphant, and rescued zo-1b/3 YSL-morphant embryos at 7–8 hpf. Fluorescence intensity was normalized to the EVL cortical signal. Data are mean ± SEM; unpaired t test; YSL-Ctrl with N = 4, n = 8 and zo-1b/3 YSL-morphant with N = 5, n = 8; rescued zo-1b/3 YSL-morphant with N = 6, n = 13. (D) Kymograph of Myosin-2 flow velocities along the animal-vegetal (AV) axis of the embryo as a function of time during epiboly in an exemplary YSL-Ctrl, zo-1b/3 YSL-morphant and rescued zo-1b/3 YSL-morphant embryo at 7–8 hpf. The kymograph ranges from negative values (blue and blue arrow) indicating retrograde flows toward the EVL margin to positive values (red and red arrow) indicating anterograde flows toward the vegetal pole. Dashed lines mark the slope of EVL movement (black, YSL-Ctrl; blue, zo-1b/3 YSL-morphant; pink, rescued zo-1b/3 YSL-morphant embryos). The EVL is located above the dashed line and the YSL below. (D’) Plot of Myosin-2 mean flow velocities along the AV axis, averaged over 5–30 min in YSL-Ctrl, zo-1b/3 YSL-morphant, and rescued zo-1b/3 YSL-morphant embryos between 7 and 8 hpf. Data are mean ± SEM. EVL peak velocities were averaged over 10 μm; unpaired t test. YSL peak velocities were averaged over 45 μm (15–60 μm from the EVL margin); Mann-Whitney test; N/n same as in (C’). (E and F) MIPs of the EVL-YSL boundary in Myosin-2-expressing Tg(actb1:myl12.1-eGFP) YSL-Ctrl and zo-1b/3 YSL-morphant embryos at 7–8 hpf (E) and Tg(actb1:myl12.1-eGFP)-expressing WT embryos at 6 and 8 hpf (F) after UV laser cutting (fourth post-cut frame) along a 5-μm line oriented perpendicular to the boundary. Scale bar, 10 μm. (E’ and F’) Exemplary kymographs of EVL-YSL junctional opening in response to UV laser cutting as a function of time for the conditions shown in (E) and (F). Horizontal scale bar, 1.2 s; vertical scale bar, 1 μm. (E’’ and F”) Plot of initial recoil velocities of EVL-YSL junctions after UV laser cutting for the conditions shown in (E) and (F). Data are shown as box-and-whisker plots (whiskers, Tukey); unpaired t test; YSL-Ctrl and zo-1b/3 YSL-morphant with each N = 2, n = 12; WT embryos at 6 hpf and 8 hpf with each N = 3, n = 17. ∗∗∗∗p < 0.0001, ∗∗∗p < 0.001, ∗∗p < 0.01, ∗p < 0.05; n, number of embryos. See also Figure S2 and Videos S1 and S2. |
| Fish: | |
|---|---|
| Knockdown Reagents: | |
| Observed In: | |
| Stage: | 90%-epiboly |
Reprinted from Cell, 179, Schwayer, C., Shamipour, S., Pranjic-Ferscha, K., Schauer, A., Balda, M., Tada, M., Matter, K., Heisenberg, C.P., Mechanosensation of Tight Junctions Depends on ZO-1 Phase Separation and Flow, 937-952.e18, Copyright (2019) with permission from Elsevier. Full text @ Cell