
Fig. 2
- ID
- ZDB-FIG-200318-26
- Publication
- Lombardo et al., 2019 - Morphogenetic control of zebrafish cardiac looping by Bmp signaling
- Other Figures
- All Figure Page
- Back to All Figure Page
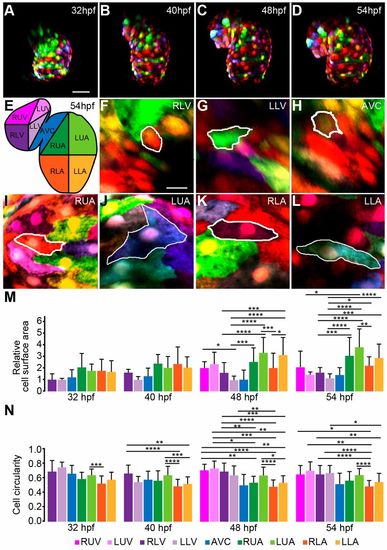
Anisotropic growth of myocardial cells contributes to asymmetric ballooning of the heart chambers. (A-D) Reconstructions of confocal z-scan images taken from a time series (32-54 hpf). Individual cell size and shape changes during cardiac looping stages were quantified based on in vivo multi-color mosaic-labeling by 1- to 4-cell stage plasmid injections into Tg(myl7:EGFP)twu34 transgenic zebrafish (false-colored red). (E) Schematic of different heart chamber regions at 54 hpf. RUV, right upper ventricle; LUV, left upper ventricle; RLV, right lower ventricle; LLV, left lower ventricle; AVC, atrio-ventricular canal; RUA, right upper atrium; LUA, left upper atrium; RLA, right lower atrium; LLA, left lower atrium. (F-L) Regional differences in myocardial cell surface areas and morphologies at 54 hpf. (M,N) Quantifications of dynamic changes in (M) myocardial cell surface area (values are shown relative to the RLV region at 32 hpf) and (N) myocardial cell circularity between 32 and 54 hpf. Kruskal–Wallis test was used for multiple comparisons between the different cardiac regions (statistical analysis in Tables S4 and S5). Data are mean±s.d.; *P≤0.05; **P≤0.01; ***P≤0.001; ****P≤0.0001. Scale bars: 50 μm in A-D; 10 μm in F-L. |