FIGURE

Figure 3

ID
ZDB-FIG-200311-18
Publication
Pringle et al., 2019 - The Zebrafish Xenograft Platform-A Novel Tool for Modeling KSHV-Associated Diseases
Other Figures
All Figure Page
Back to All Figure Page
Figure 3

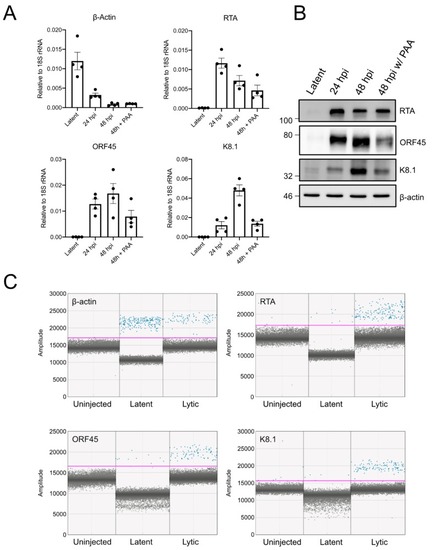
Detection of viral gene expression in xenotransplanted cells by ddPCR: (A) TREx-BCBL1-RTA cells reactivated with 1 µg/mL of doxycycline in culture and RNA was harvested at latent cells, or cells undergoing lytic replication at 24 or 48 h post-induction (hpi). Then, 500 µM phosphonoacetic acid (PAA) was used to inhibit replication of the viral genome and late gene expression; RT-qPCR was used to measure transcript abundance of β-actin, RTA (immediate early), ORF45 (early) and K8.1 (late) (n = 4 independent experiments; means ± SEM); (B) Western blot of cells treated as in (A) to confirm accumulation of target proteins; (C) ddPCR amplification plot for β-actin, RTA, ORF45, and K8.1. The x axis displays individual events, and the y axis is fluorescence amplitude. For all targets, we tested cDNA generated from uninjected larvae, or larvae injected with untreated TREx-BCBL1-RTA cells or cells treated with 1 µg/mL doxycycline for 12 h prior to injection. RNA was harvested from larvae at 48 hpi. The pink threshold line separates positive reaction droplets (blue) from negative droplets (gray).

Expression Data

Expression Detail
Antibody Labeling
Phenotype Data

Phenotype Detail
Acknowledgments
This image is the copyrighted work of the attributed author or publisher, and ZFIN has permission only to display this image to its users. Additional permissions should be obtained from the applicable author or publisher of the image. Full text @ Viruses