|
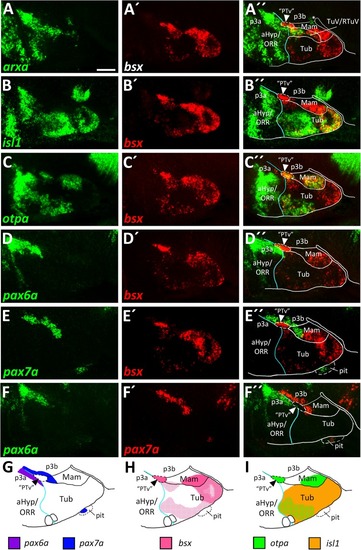
bsx expression in relation to other patterning factors within the basal hypothalamus. (A–F″) Sagittal optical sections of zebrafish embryos 48 hpf, stained by double-fluorescent whole-mount in situ hybridization using probes as indicated. Schematics show expression patterns of pax6a, pax7a(G), bsx(H), otpa and isl1(I) in and close to the basal hypothalamus. Asterisk in (A″) indicates arxa expression in the floor plate. Arrowheads indicate the domain we operationally define as “PTv.” The alar-basal boundary is shown in cyan. Maximum intensity projections of 20 (A–B″,D–E″), 25 (F–F″), or 30 (C–C″) 1 μm confocal planes. Abbreviations see list. Scale bar 50 μm.
|