|
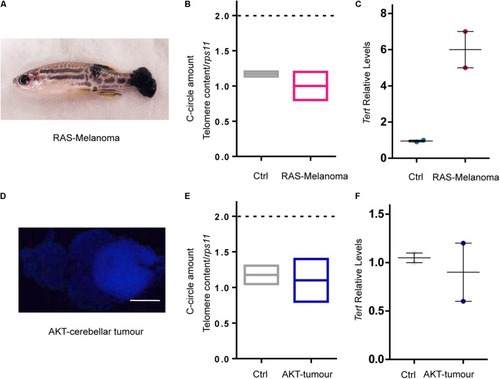
RAS expression is not the main driver of ALT in zebrafish cancer. (A) Image of a fish with melanoma induced by overexpression of oncogenic RAS. (B) C-Circle quantification by telomeric qPCR in control skin and melanoma (n = 2). (C) Measurement of tert expression in control skin and melanoma. Values were normalized first to rps11 mRNA and then to tert expression in control skin (n = 2). (D) Image of a zebrafish brain with an AKT – driven cerebellar tumor. Calibration bar: 0.5 mm. (E) C-Circle quantification by telomeric Q-PCR in control brain and AKT – driven cerebellar tumors (n = 2). (F) Measurement of tert expression in control brains and AKT – driven cerebellar tumors. Values were normalized first to rps11 and then to tert expression in control brains (n = 2). Bars represent mean ± SEM.
|