FIGURE

Figure 3

ID
ZDB-FIG-200226-33
Publication
Chávez et al., 2020 - Autophagy Activation in Zebrafish Heart Regeneration
Other Figures
All Figure Page
Back to All Figure Page
Figure 3

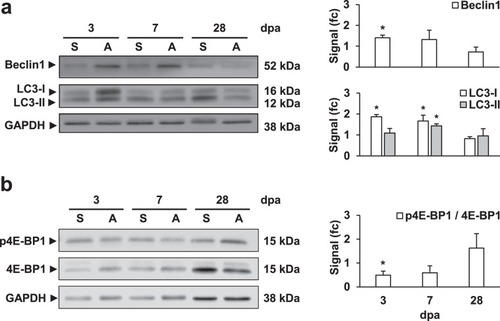
Western blot analysis suggests the activation of autophagy at the early stages of cardiac regeneration. The stimulation of autophagy at 3 dpa and the increased formation of autophagosomes between days 3–7 post-amputation, in comparison to sham-operated animals, is observed in the increased abundance of Beclin1, Lc3-I and Lc3-II, respectively (a). Moreover, a significant decrease on the phosphorylation ratio of the mTOR-target 4E-BP1 suggests the inhibition of mTOR at the early regeneration stages (b). Signal levels were normalized first to GAPDH-loading controls and then compared to the respective sham-control. Results were obtained from at least three biological replicates and averaged for the final statistical analysis. Representative blot-images of are shown, while full-length blots are presented in the Supplementary Information (Supp. Fig. 1). fc: fold change. *p ≤ 0.05. N ≥ 3.

Expression Data

Expression Detail
Antibody Labeling
Phenotype Data

Phenotype Detail
Acknowledgments
This image is the copyrighted work of the attributed author or publisher, and ZFIN has permission only to display this image to its users. Additional permissions should be obtained from the applicable author or publisher of the image. Full text @ Sci. Rep.