FIGURE

Figure 3

ID
ZDB-FIG-200220-18
Publication
de Medeiros et al., 2020 - Cell and tissue manipulation with ultrashort infrared laser pulses in light-sheet microscopy
Other Figures
All Figure Page
Back to All Figure Page
Figure 3

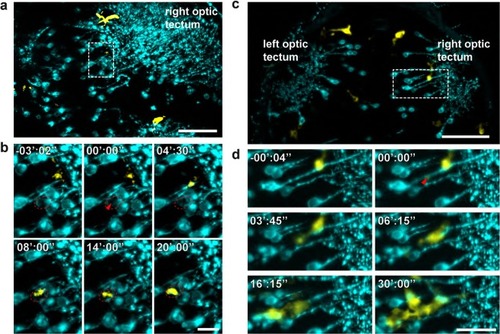
Single soma and axon dissection in the brain of a 5 day post fertilization zebrafish expressing Synaptophysin-GFP. (a,c) Maximum intensity projections of the regions encompassing the ablation volumes, depicted in dashed boxes. Scale bars are 50 μm. (b) Time lapse of single soma ablation within the dashed box shown in a), where the neighboring neuron remains intact. Localization of the ablation spot is depicted within the dashed red ellipse, by the red arrow. As a result, the Synaptophysin signal is reduced, and a microglia interacts with the ablated soma, reaching the region around 8 minutes after ablation, from ~22 µm distance. 0 seconds corresponds to the time of ablation. Scale bar is 10 μm. (d) Time lapse of an axon cut. 6 minutes after laser ablation a microglia, located 15 µm away, moves to the ablation site, shortly followed by two others. Cyan: Synaptophysin-sfGFP, yellow: pu.1-RFP. Scale bar is 20 μm.

Expression Data

Expression Detail
Antibody Labeling
Phenotype Data

Phenotype Detail
Acknowledgments
This image is the copyrighted work of the attributed author or publisher, and ZFIN has permission only to display this image to its users. Additional permissions should be obtained from the applicable author or publisher of the image. Full text @ Sci. Rep.