
Figure 1
- ID
- ZDB-FIG-200130-27
- Publication
- Eskova et al., 2019 - Galanin Signaling in the Brain Regulates Color Pattern Formation in Zebrafish
- Other Figures
- All Figure Page
- Back to All Figure Page
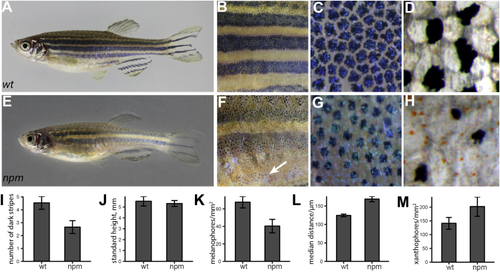
The (A–D) Wild-type adult zebrafish (A), magnified mid-trunk area (B), expanded melanophores (C), and detail of 1st ventral dark stripe in fixed specimen (D). (E–H) (I and J) Number of dark stripes (I) in fish of comparable height (J) (mean ± SD, n = 10). (K) Density of melanophores (mean ± SD, n = 10). (L) Distance between melanophores in the 1st ventral stripe (median ± SD, n = 10). (M) Density of xanthophores in the first light stripe (mean ± SD, n = 10). |
| Fish: | |
|---|---|
| Observed In: | |
| Stage: | Adult |