
FIGURE
Figure 6
- ID
- ZDB-FIG-200125-17
- Publication
- Chen et al., 2020 - Microarray Expression Profiling and Raman Spectroscopy Reveal Anti-Fatty Liver Action of Berberine in a Diet-Induced Larval Zebrafish Model
- Other Figures
- All Figure Page
- Back to All Figure Page
Figure 6
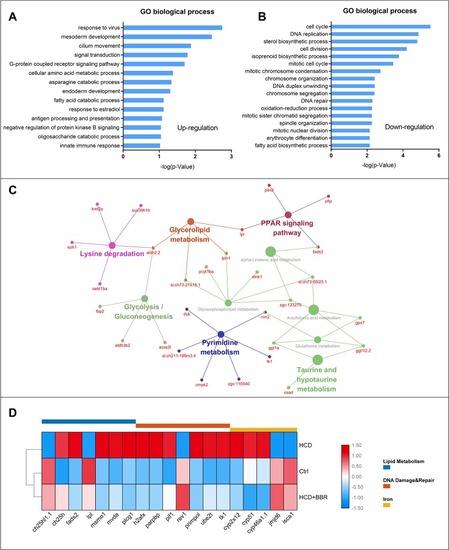
Gene ontology, KEGG enrichment, and functional category analysis. |
Expression Data
Expression Detail
Antibody Labeling
Phenotype Data
Phenotype Detail
Acknowledgments
This image is the copyrighted work of the attributed author or publisher, and
ZFIN has permission only to display this image to its users.
Additional permissions should be obtained from the applicable author or publisher of the image.
Full text @ Front Pharmacol