
Fig. 4
- ID
- ZDB-FIG-200109-9
- Publication
- Andrés-Delgado et al., 2019 - Actin dynamics and the Bmp pathway drive apical extrusion of proepicardial cells
- Other Figures
- All Figure Page
- Back to All Figure Page
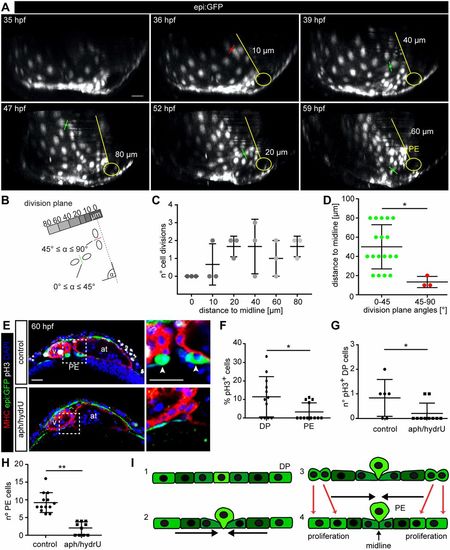
Proliferation of dorsal pericardial cells contributes to proepicardium formation. (A) 3D projection of six frames of an epi:GFP embryo in vivo time lapse (see also Movie 4). Division planes indicated with red (45°≤α≤90°) or green (0°≤α≤45°) lines. A representation of the midline and the venous pole is shown in yellow. The distance of the division to the midline is indicated. (B) Scheme showing the principle of measurements for distance and angles of division planes to midline. (C) Number of cell divisions during in vivo time-lapse imaging relative to their distance to midline (three embryos with 20 cell divisions each). (D) Angles of cell division planes and their distance relative to the midline. A-D, data from ≥10 biological and ≥2 technical replicates. (E) Immunostaining for GFP (green), Myosin heavy chain (red) and pH3 (white). DAPI counterstained nuclei (blue). Optical sections of a control heart or embryos treated with aphidilcolin and hydroxyurea (aph/hydrU). Zoomed view of the PE area on the right. Arrowheads, PE cells. (F) Percentage of pH3+ cells in the dorsal pericardium (DP) compared with the PE in control animals. (G) Quantification of total number of pH3+ cells in the DP. (H) Quantification of PE cell number. (I) Scheme of PE extrusion mechanism: (1) DP is a flattened mesothelium; (2) DP cells move towards the midline; (3) PE cells round up at the midline; (4) DP cell proliferation contributes to the constriction and PE cells finally extrude. Data are mean±s.d., Kruskal–Wallis test followed by multiple comparison test in C; two-tailed Student's t-test in D,F-H, *P<0.05; **P<0.01. at, atrium; hpf, hours post-fertilization; PE, proepicardium; v, ventricle. DP digitally isolated in 3D projections. E-H, representative data from 10 biological replicates out of one experiment. Scale bars: 20 µm. |