|
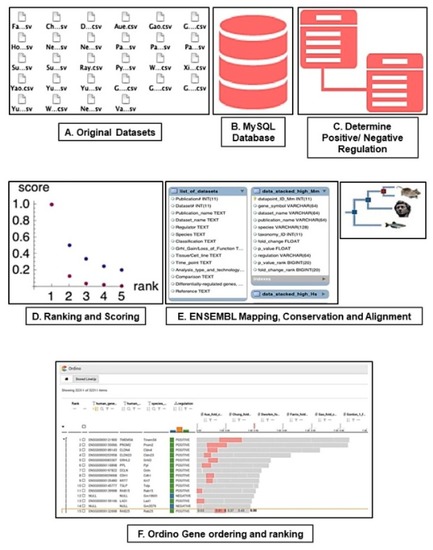
Meta-analysis pipeline methodology All published grh/Grhl Microarray/RNA-SEQ datasets were converted to a common file format (.csv, A) and imported into MySQL (B). Next, we determined whether genes within each dataset were positively or negatively regulated following functional modulation of grh/Grhl (C), and genes across the datasets were ranked according to their regulation within each dataset. To achieve a common gene ranking, the fold change rank-based scores from individual datasets were aggregated into the sum of scores for each gene, separately for positively and negatively regulated genes. (D). Each gene symbol within all datasets was mapped to the appropriate gene using Ensembl. After mapping, a table of all the human-mapped data was generated, searchable by the original gene symbol in every species (E). For interactive visualization and exploring, the data were exported from the MySQL database, re-structured and uploaded into Ordino (F).
|