FIGURE

Figure 1

ID
ZDB-FIG-191230-498
Publication
Zang et al., 2019 - RNA-seq Based Transcriptome Analysis of the Anti-Obesity Effect of Green Tea Extract Using Zebrafish Obesity Models
Other Figures
All Figure Page
Back to All Figure Page
Figure 1

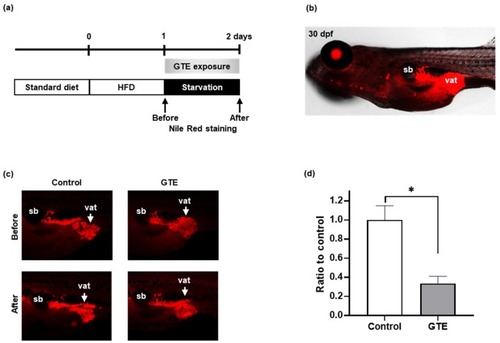
Green tea extract (GTE) suppressed lipid accumulation in zebrafish larvae. Live zebrafish at 30 dpf (day post fertilization) with a standard length of approximately 10 mm were used. (a) Experimental design of the zebrafish obesogenic (ZO) test. (b) Lateral view under a fluorescence microscope after Nile Red staining. vat, visceral adipose tissue (VAT); sb, swim bladder. (c) Representative VATs from live larva were selected after Nile Red staining, and images were recorded before and after 24 h of exposure or not to GTE (100 μg/mL). Nile Red-positive areas indicate VAT (red). (d) Quantification of the intensity of Nile Red positive staining. GTE reduced the amount of VAT compared to that in animals on a high fat diet (control). The Y axis indicates the ratio of Nile Red staining before and after GTE treatment for 24 h. * p < 0.05 vs. control, n = 5, error bars indicate SD.

Expression Data

Expression Detail
Antibody Labeling
Phenotype Data
Fish:
Conditions:
Observed In:
Stage: Days 30-44

Phenotype Detail
Acknowledgments
This image is the copyrighted work of the attributed author or publisher, and ZFIN has permission only to display this image to its users. Additional permissions should be obtained from the applicable author or publisher of the image. Full text @ Molecules