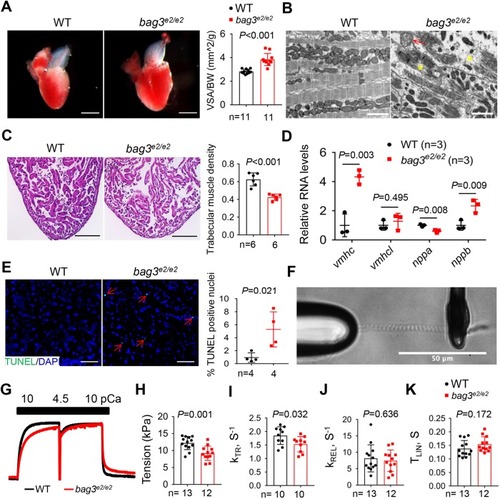
bag3e2/e2 mutants manifest hallmarks of cardiomyopathy resembling DCM in mammals. (A) Representative images of isolated hearts and quantification of the ventricular surface area (VSA) normalized to body weight (BW) in the bag3e2/e2 mutants and WT controls at 6 months. n=11, Student's t-test. (B) TEM images confirmed the myofibril degeneration phenotype (yellow asterisks) and identified abnormal mitochondrial swelling (red arrows) in the bag3e2/e2 mutant fish heart at 6 months. (C) Representative images of H&E staining in the apex area and quantification of trabecular muscle density in the bag3e2/e2 mutants and WT controls at 6 months. n=6, Student's t-test. (D) Quantitative RT-PCR analysis of cardiomyopathy molecular markers in bag3e2/e2 mutant hearts. n=3 biological replicates, Student's t-test. (E) Representative images of the TUNEL assay and quantification of the percentage of TUNEL-positive nuclei (red arrows) in the bag3e2/e2 mutant and WT control at 6 months. n=4, Student's t-test. (F) A representative image of a single myofibril isolated from the bag3e2/e2 mutant fish heart attached to glass microtools. (G) Example of a myofibril activation trace (pCa 10→4.5) with force-redevelopment during the release–restretch maneuver and relaxation when pCa was changed back from 4.5 to 10. Activation (pCa=4.5) and the fast release–restretch maneuver were used to measure kTR in myofibrils from WT and the bag3e2/e2 mutant fish heart at 6 months. (H) Quantification of maximal isometric tension in activated single myofibrils. (I-K) Rates of force redevelopment (KTR) (I), fast relaxation (KREL) (J) and the time of the linear phase of relaxation (TLIN) (K) in the bag3e2/e2 mutant and WT control at the single-myofibril level. H-K, n=10-13, Student's t-test. Data are mean±s.e.m. Scale bars: 1 mm in A; 2 µm in B; 100 µm in C; 20 µm in E; 50 µm in F.
|
