FIGURE

Figure 6

ID
ZDB-FIG-191230-29
Publication
Lechermeier et al., 2019 - Transcript Analysis of Zebrafish GLUT3 Genes, slc2a3a and slc2a3b, Define Overlapping as Well as Distinct Expression Domains in the Zebrafish (Danio rerio) Central Nervous System
Other Figures
All Figure Page
Back to All Figure Page
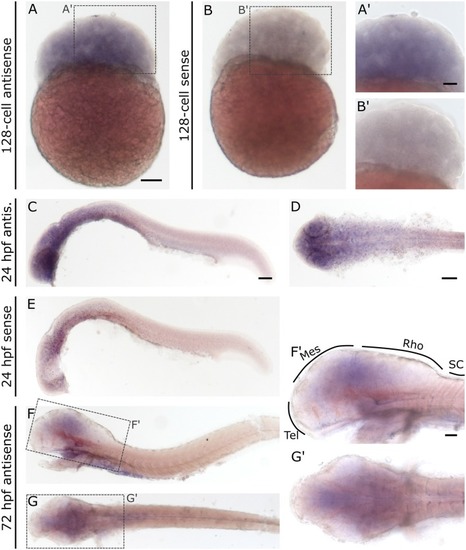
Figure 6

Whole mount RNA in situ hybridization for slc2a3b at blastula 128-cell, 24 hpf and 72 hpf stages. For comparison, a sense probe was included (B,E). Comparison of embryos incubated with antisense (A,A’,C,D) and sense (B,B’,E) show diffuse staining only in embryos incubated with the antisense probe. Pictures (F; lateral) and (G; dorsal) show 72 hpf larvae stained with antisense probe. Boxes in (F) and (G) depict locations of high magnification pictures in (F’,G’). For abbreviations see Table 1. Scale bars in (A,C,D), 100 μm and pertains to (A–G), respectively, scale bar in (A’,F’), 50 μm and pertains to (A’,B’,F’,G’), respectively.

Expression Data
Gene:
Fish:
Anatomical Terms:
Stage Range: 128-cell to Protruding-mouth

Expression Detail
Antibody Labeling
Phenotype Data

Phenotype Detail
Acknowledgments
This image is the copyrighted work of the attributed author or publisher, and ZFIN has permission only to display this image to its users. Additional permissions should be obtained from the applicable author or publisher of the image. Full text @ Front. Mol. Neurosci.