
Figure 1
- ID
- ZDB-FIG-191230-1882
- Publication
- Klingseisen et al., 2019 - Oligodendrocyte Neurofascin Independently Regulates Both Myelin Targeting and Sheath Growth in the CNS
- Other Figures
- All Figure Page
- Back to All Figure Page
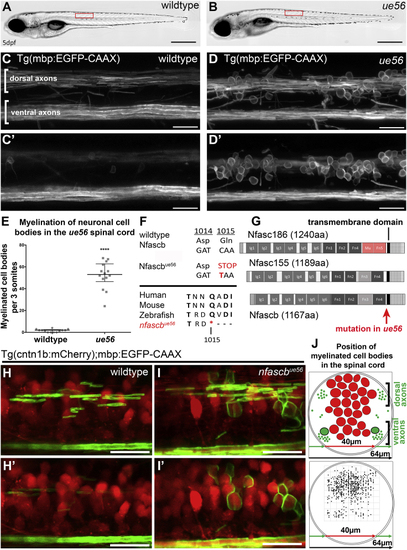
(A and B) Images of wild type (A) and (C–D′) Confocal images of myelin in a wildtype larva (C and C′) and (E) Quantitation of myelinated cell body number in wildtype and (F) Sequence at amino acid positions where the (G) Schematic of predicted domain structure of mouse neurofascin 186, neurofascin 155, and zebrafish neurofascin B, with indication of where the mutation in (H–I′) Z projections of confocal images of neurons (red) and myelin (green) in a wildtype animal (H and H′) and (J) Schematic cross section of the larval zebrafish spinal cord denoting areas with cell bodies (red) and myelinated axons (green) (Top panel). Dorso-ventral and medio-lateral positions of all myelinated cell bodies (dots) in a 3-somite long stretch of spinal cord of 11 mutants (bottom panel). |
| Genes: | |
|---|---|
| Fish: | |
| Anatomical Terms: | |
| Stage: | Day 5 |
| Fish: | |
|---|---|
| Observed In: | |
| Stage: | Day 5 |
Reprinted from Developmental Cell, 51(6), Klingseisen, A., Ristoiu, A.M., Kegel, L., Sherman, D.L., Rubio-Brotons, M., Almeida, R.G., Koudelka, S., Benito-Kwiecinski, S.K., Poole, R.J., Brophy, P.J., Lyons, D.A., Oligodendrocyte Neurofascin Independently Regulates Both Myelin Targeting and Sheath Growth in the CNS, 730-744.e6, Copyright (2019) with permission from Elsevier. Full text @ Dev. Cell