
Figure 2
- ID
- ZDB-FIG-191230-1824
- Publication
- O'Brown et al., 2019 - Suppression of transcytosis regulates zebrafish blood-brain barrier function
- Other Figures
- All Figure Page
- Back to All Figure Page
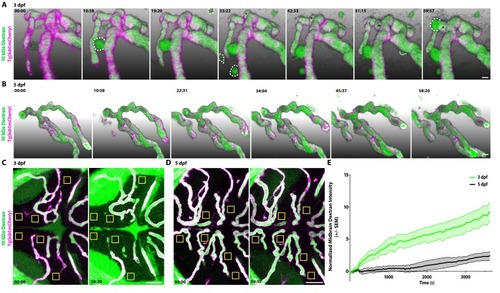
(A) Time course stills from Figure 2—Video 1 of tracer leakage at 3 dpf reveal an increase in parenchymal cells absorbing the Dextran tracer (outlined by dashed white lines) as well as a general increase in overall Dextran (green) intensity outside of the vasculature (magenta). An angiogenic tip cell becomes apparent at 33:23 and is demarcated by an asterisk (*). This tip cell produces two separate bursts of leakage observed in Figure 2—Video 2. (B) Time course stills from Figure 2—Video 3 of Dextran tracer dynamics at 5 dpf reveals a mature BBB, with reduced overall Dextran extravasation into the brain parenchyma. The scale bars represent 10 µm. (C and D) Dorsal maximum intensity projection of the midbrain at 3 dpf (C) and 5 dpf (D) at the first and last time point examined. While there is a large increase in overall parenchymal Dextran intensity over time at 3 dpf, the 5 dpf midbrain parenchyma appears relatively unaltered after an hour of Dextran circulation. Boxed regions are representative of the six areas per fish used for analysis in E. The scale bars represent 50 µm. (E) Quantification of Dextran intensity in the brain parenchyma over time at 3 dpf (green) and 5 dpf (black) shows a significant difference in tracer leakage dynamics (p<0.0001, Mann Whitney U test), with both more total Dextran accumulation and a faster rate of Dextran accumulation in the brain parenchyma at 3 dpf. N = 6 fish with 6 regions analyzed per fish. |