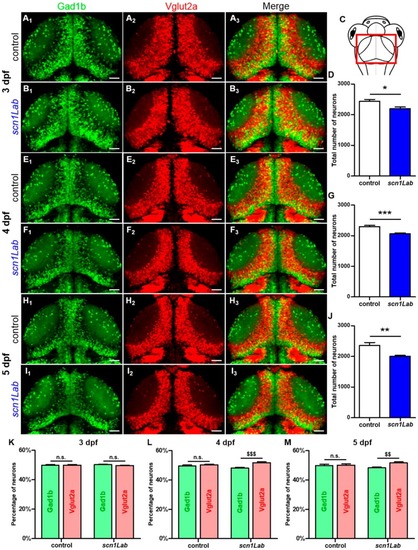
Evolution of the excitatory-inhibitory neuronal population in the scn1Lab model. (A1-3,B1-3) Dorsal view of 3 dpf Tg[Gad1b:GFP; Vglut2a:DsRed] control (A1-3) (N = 8) and scn1Lab (B1-3) (N = 8) living larvae. (A1,B1) Inhibitory neurons (Gad1b:GFP) in 3 dpf control (A1) and scn1Lab (B1) larvae. (A2,B2) Excitatory neurons (Vglut2a:DsRed) in 3 dpf control (A2) and scn1Lab (B2) larvae. (A3,B3) Merged image of 3 dpf control (A3) and scn1Lab (B3) larvae. (C) Dorsal view schematic of a 4 dpf larva. The red rectangle shows the region of interest. (E1-3,F1-3) Dorsal view of 4 dpf Tg[Gad1b:GFP; Vglut2a:DsRed] control (E1-3) (N = 8) and scn1Lab (F1-3) (N = 8) living larvae. (E1,F1) Inhibitory neurons (Gad1b:GFP) in 4 dpf control (E1) and scn1Lab (F1) larvae. (E2,F2) Excitatory neurons (Vglut2a:DsRed) in 4 dpf control (E2) and scn1Lab (F2) larvae. (E3,F3) Merged image of 4 dpf control (E3) and scn1Lab (F3) larvae. (H1-3,I1-3) Dorsal view of 5 dpf Tg[Gad1b:GFP; Vglut2a:DsRed] control (H1-3) (N = 8) and scn1Lab (I1-3) (N = 8) living larvae. (H1,I1) Inhibitory neurons (Gad1b:GFP) in 5 dpf control (H1) and scn1Lab (I1) larvae. (H2,I2) Excitatory neurons (Vglut2a:DsRed) in 5 dpf control (H2) and scn1Lab (I2) larvae. (H3,I3) Merged image of 5 dpf control (H3) and scn1Lab (I3) larvae. (D,G,J) Number of neurons in control and scn1Lab larvae at 3 dpf (D), 4 dpf (G) and 5 dpf (J). (K,L,M) Number of inhibitory and excitatory neurons in control and scn1Lab larvae at 3 dpf (K), 4 dpf (L) and 5 dpf (M). All images are representative 20 µm stacks acquired using LSM 880 Zeiss laser scanning confocal microscope equipped with a WPApo 20x/1.0 objective. Scale bar 40 µm. N = number of embryos. Error bars on all graphs represent standard error mean (SEM). * p < 0.05; ** p < 0.01; ***,p < 0.001 indicate a statistically significant difference between control and scn1Lab larvae. Statistically significant difference between inhibitory and excitatory neuronal population is indicated as $$, p < 0.01; $$$, p < 0.001. p-values were determined using Student’s unpaired t-test.
|
