FIGURE

Figure 3

ID
ZDB-FIG-191230-1575
Publication
Johansson et al., 2019 - Dkk1 Controls Cell-Cell Interaction through Regulation of Non-nuclear β-Catenin Pools
Other Figures
All Figure Page
Back to All Figure Page
Figure 3

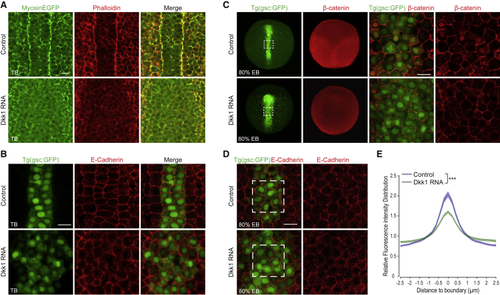
Dkk1 Reduces Cell Adhesion

(A) Single-plane confocal imaging, dorsal view, of tail bud stage embryos (n = 6 of each condition) ubiquitously expressing EGFP-tagged myosin light chain (MyosinEGFP, green) stained with phalloidin (red) labeling filamentous actin. Scale bar, 20 μm.

(B) Single-plane confocal images of axial cells in Tg(gsc:GFP) embryos (green axis) acquired at the tail bud (TB) stage, showing lack of organized cell-cell adhesions by E-cadherin antibody staining (red) in Dkk1-expressing embryos (n = 8 for each condition). Scale bar, 20 μm.

(C) Distribution of endogenous β-catenin (red) in Tg(gsc:GFP) embryos (green axis). Dorsal view maximum projections of embryos were acquired at 80% epiboly (EB). Dashed squares indicate the area of higher magnification shown on the right panels in single-plane confocal images. Single-plane higher magnification confocal images reveal loss of cell-cell adhesion integrity in axial cells of Dkk1-RNA-injected embryos. Control (Ctrl) n = 14 and Dkk1 RNA n = 16. Scale bar, 20 μm.

(D) Tg(gsc:GFP) embryos stained with anti-E-cadherin (red). Dashed squares show one example of six neighboring cells in control and Dkk1-expressing embryos, used for quantification of E-cadherin distribution across boundaries. Dkk1-expressing embryos exhibit a diffuse distribution of E-cadherin (red) compared to the control, indicating a loss of cell-cell adhesion (n = 5 for each condition). Scale bar, 20 μm.

(E) Quantification of E-cadherin distribution across boundaries between neighboring axial (green) cells. Normalized intensity distributions across cell-cell boundaries show that Dkk1 expression reduces E-cadherin intensity at cell boundaries and broadens lateral distribution of E-cadherin intensity. Normalized intensity distributions were calculated for boundaries between six neighboring cells in five embryos for both control and Dkk1-expressing embryos. ∗∗∗p < 0.001. p value was calculated using the Kolmogorov-Smirnov test.

Expression Data

Expression Detail
Antibody Labeling
Phenotype Data

Phenotype Detail
Acknowledgments
This image is the copyrighted work of the attributed author or publisher, and ZFIN has permission only to display this image to its users. Additional permissions should be obtained from the applicable author or publisher of the image.

Reprinted from Developmental Cell, 51(6), Johansson, M., Giger, F.A., Fielding, T., Houart, C., Dkk1 Controls Cell-Cell Interaction through Regulation of Non-nuclear β-Catenin Pools, 775-786.e3, Copyright (2019) with permission from Elsevier. Full text @ Dev. Cell