|
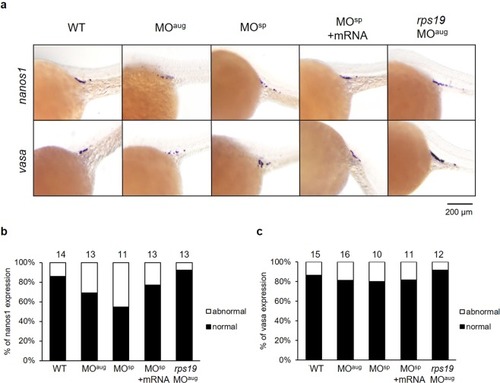
(a) Whole-mount in situ hybridization showing the expression of PGC marker genes, including nanos1 and vasa, after morpholino injection at 25 hpf. The reduction of nanos1 and vasa expression intensity was obviously observed in MOaug-injected embryos. The nanos1 expression was also decreased in MOsp-injected embryos and it was recovered when mRNA was co-injected. The expression levels of nanos1 (b) and vasa (c) were graded as the normal and abnormal percentage. The mean pixel intensity of nanos1 and vasa gene expression of the normal embryos were 24.7 ± 8.7 and 22.6 ± 8.2, respectively. An abnormal level of the gene expression was taken as one with the value less than the mean minus one standard deviation of the gene expression of the wild-type, i.e., less than 16 for nanos1 and 14.4 for vasa gene. The number of animals quantified in each group are shown on top of the bars.
|