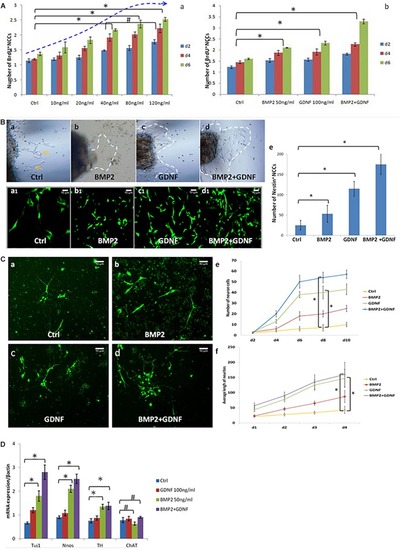
BMP2 promotes the proliferation migration and differentiation of NCCs. (A) BMP2 promote NCCs proliferation in a concentration-dependent manner. (A,a) Exposure to concentrations of BMP2 between 10 and 80 ng/ml for 2, 4, and 6 days significantly promoted NCC proliferation. There was no significant difference of NCC proliferation in the BMP2 concentration between 80 and 120 ng/ml (n = 3, 2-way ANOVA, ∗P < 0.05, compared with ctrl; #P > 0.05, compared with 40 ng/ml group); (A,b) BMP2 and GDNF significantly promoted NCC proliferation (n = 3, 2-way ANOVA, ∗P < 0.05, compared with ctrl). (B) Both BMP2 and GDNF promote migration of Nestin+ NCCs. Cells were treated with DMSO, GDNF, BMP2, or both GDNF and BMP2 for 2 days. Compared with control group (B,a,a1), there were more Nestin + NCCs migrating into the collagen gel (B,b,b1,c,c1,d,d1); (B,e) Values are given as mean ± SE. n = 3, t-test, ∗P < 0.05, compared with control. (C) Immunofluorescence images showing primary enteric neurons (Tuj1+) cultured when treated with GDNF, BMP2, or both. Cells were treated with DMSO, GDNF, BMP2, or both GDNF and BMP2 for 2 days. Primary enteric neurons were labeled with Tuj1. (C,e) The number of neuron cells were counted. Values are given as mean ± SE. n = 3, 2-way ANOVA, ∗P < 0.05, compared with ctrl. (C,f) The average length of neuritis were measured. Values are given as mean ± SE. n = 3, 2-way ANOVA, ∗P < 0.05, compared with ctrl. (D) Real time-PCR was done by using RNA from NCCs treated with GDNF, BMP2, or both GDNF and BMP2 for 48 h and probed for different genes. A clear increase in TUJ1 expression was noted in cells cultured in the presence of BMP2 or GDNF. BMP2 also promoted the expression of nNOS and catecholaminergic neurons (TH expression) but had no effect on the expression of ChAT. Values are given as mean ± SE, n = 3, t-test, ∗P < 0.05, compared with BMP2 and BMP2 + GDNF treatment group; #P > 0.05, compared with BMP2 and BMP2 + GDNF treatment group.
|
