
Fig. S4
- ID
- ZDB-FIG-191112-9
- Publication
- Murdoch et al., 2019 - Intestinal Serum amyloid A suppresses systemic neutrophil activation and bactericidal activity in response to microbiota colonization
- Other Figures
- All Figure Page
- Back to All Figure Page
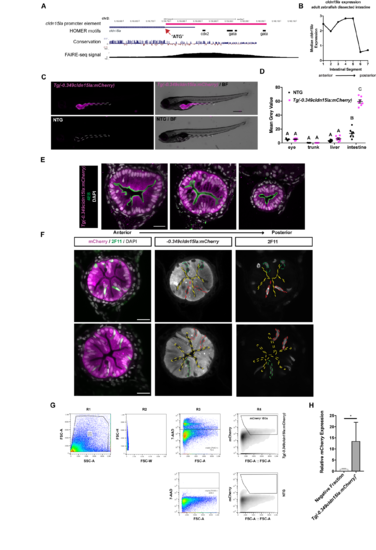
Characterization of the zebrafish cldn15la promoter used to drive intestine-specific saa expression.(A) UCSC genome browser view of the zebrafish cldn15la gene locus with the translational start indicated by the red arrow. Pink bar represents the cloned 349 bp promoter region upstream of the cldn15la gene used to drive intestine-specific transgene expression. Tracks for vertebrate conservation, FAIRE-seq and motifs for transcription factors important of IEC gene expression programs (identified by HOMER) are shown below the locus [60]. (B) Expression pattern of endogenous cldn15la along the length of the intestine in adult zebrafish, as measured by microarray in Wang et al., 2010 [59]. (C) Representative stereoscope images of IEC specific cytosolic mCherry expression in 5 dpf Tg(-0.349cldn15la:mCherry)rdu65 larvae compared to non-transgenic (NTG) controls (scale bar = 500 μm). White dashed line indicates the intestine. (D) Quantification of mCherry fluorescence in the indicated tissues of 6 dpf Tg(-0.349cldn15la:mCherry) and non-transgenic control larvae demonstrated intestine-restricted mCherry reporter activity (n = 7 larvae / genotype). (E) Representative confocal micrographs of immunostained transverse sections of Tg(-0.349cldn15la:mCherry) 6 dpf larvae along the anterior-posterior axis labeled with the absorptive cell brush border-specific antibody 4E8 illustrated transgene expression in absorptive enterocytes (scale bar = 20 μm). (F)Representative immunofluorescence images of transverse sections from Tg(-0.349cldn15la:mCherry) 6 dpf larvae stained with secretory cell-specific antibody 2F11 demonstrated weak expression in secretory cells, including enteroendocrine cells (outlined by red dashed lines) and goblet cells (outlined by green dashed lines) (scale bar = 20 μm). (G)Gating strategy for isolation of -0.349cldn15la:mCherry+ IECs from larval zebrafish. (H) qPCR for mCherry transcript in sorted Tg(-0.349cldn15la:mCherry) IECs showed enrichment as compared to negative fraction (13,000 –0.349cldn15la:mCherry+ or mCherry negative cells / replicate, 4 replicates / genotype, 30 larvae / replicate). Data in panel D analyzed by one-way ANOVA with Tukey’s multiple comparison’s test. Data in panel H analyzed by a Mann-Whitney test. Data are presented as mean ± SEM. * p < 0.05, ** p < 0.01, *** p < 0.001, **** p < 0.0001. |
| Gene: | |
|---|---|
| Fish: | |
| Anatomical Term: | |
| Stage Range: | Day 5 to Day 6 |