
Fig. 3
- ID
- ZDB-FIG-190822-33
- Publication
- Sanz-Morejón et al., 2019 - Wilms Tumor 1b Expression Defines a Pro-regenerative Macrophage Subtype and Is Required for Organ Regeneration in the Zebrafish
- Other Figures
- All Figure Page
- Back to All Figure Page
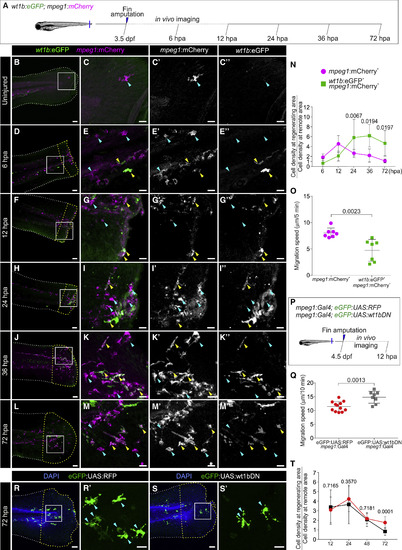
wt1b:eGFP+ Macrophages Home to the Site of Injury during Caudal Fin Regeneration, and Wt1b Regulates Their Migratory Behavior (A) Caudal fins from Tg(wt1b:eGFP;mpeg1:mCherry) zebrafish larvae were amputated at 3.5 dpf and either fixed at different time points and processed for IF or embedded for in vivo imaging. (B–M’’) Whole-mount IF on caudal fins. Merged and single eGFP and mCherry channels of the magnified views from boxed areas are shown on the right panels. The yellow arrowheads point to double-positive cells, and the blue arrowheads to single mCherry+ cells. The white and yellow dotted lines outline the remote and regenerating areas, respectively. The regenerating area is defined as 100 μm distal from the amputation plane until the fin tip. Maximum intensity projections are shown. Also shown are representative images from 6 hpa (n = 7), 12 hpa (n = 6), 24 hpa (n = 8), 36 hpa (n = 4), and 72 hpa (n = 5) samples from 2 experimental replicates. (N) Accumulation index of eGFP+;mCherry+ or mCherry+macrophages at the regenerating area of animals from (D)–(M’’). Calculated as cell density at the regenerating area/cell density at the remote area. Two-way ANOVA, followed by Sidak’s post hoc test. (O) Quantification of the migration speed of eGFP+;mCherry+ versus mCherry+ macrophages. The dots indicate mean values for macrophages counted in n = 7 larvae from 3 experimental replicates. Means ± SDs are shown; two-tailed unpaired t test. (P) Analysis of migratory behavior of macrophages during the first 12 hpa upon Wt1b inhibition by expressing a dominant-negative isoform in macrophages using the Gal4;UAS system. (Q) Quantification of macrophage migration speed. Means ± SDs are shown. Individual points represent the average migration of all macrophages per embryo from 3 experimental replicates. Two-tailed unpaired Student’s t test. (R–S’) Whole-mount IF on caudal fins from Tg(eGFP:UAS:RFP) (R) and Tg(eGFP:UAS:wt1bDN) (S) lines, both in Tg(mpeg1:Gal4)background. (R’) and (S’) are magnified views of boxed areas in (R) and (S), respectively; arrowheads point to eGFP+ macrophages. The white and yellow dotted lines outline the remote and regenerating areas, respectively. The regenerating area is defined as 100 μm distal from the amputation plane until the fin tip. The maximum intensity projections are shown. (T) Accumulation index of eGFP:UAS:RFP or eGFP:UAS:wt1bDN macrophages at the regenerating area of animals from (R)–(S’) at 12, 24, 48, and 72 hpa, calculated as in (N). An average of n = 12 embryos was analyzed per time point; two-tailed unpaired t test. Scale bars, 50 μm (B, D, F, H, J, L, R, and S) and 20 μm (magnified views). dpf, days post-fertilization; hpa, hours post-amputation. |
| Genes: | |
|---|---|
| Fish: | |
| Condition: | |
| Anatomical Terms: | |
| Stage Range: | Protruding-mouth to Day 6 |
| Fish: | |
|---|---|
| Condition: | |
| Observed In: | |
| Stage Range: | Protruding-mouth to Day 6 |