
Fig. 4
- ID
- ZDB-FIG-190821-10
- Publication
- Voltes et al., 2019 - Yap/Taz-TEAD activity links mechanical cues to progenitor cell behavior during zebrafish hindbrain segmentation
- Other Figures
- All Figure Page
- Back to All Figure Page
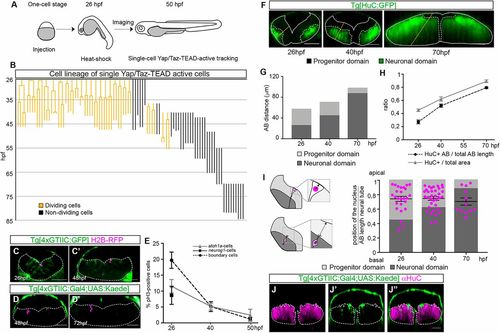
Boundary cells switch their proliferative behavior over time. (A) Scheme depicting the outline of the experiment: Tg[4xGTIIC:GFP] embryos were injected at the one-cell stage with hsp:H2B-RPF and heat-shocked at 26 hpf, or were injected at the eight-cell stage with H2B-mCherry (not shown). Embryos displaying red nuclei within the Yap/Taz-active boundary cells were then imaged up to the desired stage (Fig. S2). (B) Representation of the Yap/Taz-TEAD active cell lineage tree with the y-axis displaying the time of embryonic development in hours post-fertilization (hpf). The 63 cell lineages are displayed from the moment of tracking onwards and are color-coded according to proliferative behavior (orange, dividing; black, non-dividing). Each line corresponds to a single cell tracked starting from the beginning of the movie until the end (Table 1); branches indicate cell divisions. An interrupted line means either the end of the movie or that the cell was lost from the field. There is a switch in cell proliferative behavior from 40 hpf onwards, from which time most of the 4xGTIIC:GFP cells do not divide and therefore do not branch. Yap/Taz-active derivatives can be tracked beyond Yap/Taz-TEAD activity due to the stability of the GFP protein. (C,C′) Stills from a time-lapse movie that followed a single cell from 26 hpf to 48 hpf; the cell underwent two cell divisions giving rise to four cells (Movie 1). (D,D′) Representative example of a group of three cells photoconverted at 48 hpf and followed until 72 hpf. The number of cells does not change during this 24 h period, supporting the previous observation of a switch in cell proliferation behavior. (E) Graph showing the percentage of cells undergoing cell division over time in different hindbrain cell populations: Yap/Taz-TEAD proliferating boundary cells (black circles and dashed line); atoh1a-positive rhombomeric cells (gray triangles and solid line) and neurog1-positive cells (black square) in the flanking boundary regions. There is a difference in the percentage of cells undergoing mitosis in boundaries (19%) versus other hindbrain territories (atoh1a-positive cells, 11.5%; neurog1-positive cells, 8.5%) at 26 hpf; the boundary cell population dramatically changes its proliferative behavior after the offset of Yap/Taz-activity (5.7% at 40 hpf). (F) Images showing the development of the neuronal differentiation domain in Tg[HuC:GFP] embryos from 26 hpf to 70 hpf. (G) Histogram displaying the actual size of the progenitor versus neuronal domains at the indicated stages. Data were obtained from Tg[HuC:GFP] embryos whose apicobasal (AB) length was measured (the length extending from the apical ventricular zone edge to the basal mantle zone according to cell orientation within the neural epithelium; n=8-10 boundaries of four or five embryos/stage). There is a dramatic increase in the size of the neuronal domain at the expense of the progenitor domain over time. (H) Comparison of the two methods used for growth assessment. The ratio of distances measured between the apical/ventricular and basal/mantle borders of the HuC domain (black circles and dashed line) versus the measurement of the HuC area (gray triangles and solid line) of an average of 12-18 boundaries (6-9 embryos) is shown. These two approaches provide equivalent estimates of progenitor/neuronal domain progression. (I) Analysis of the position along the apicobasal axis of the nuclei of cells tracked in B at different times. Positional values were plotted (magenta dots) and overlaid with the information obtained from the progenitor/neuronal map. Briefly, nuclear position was scored by measuring the distance from the cell nucleus to the apical side, according to the drawing, and the result was normalized taking into consideration the thickness of the neural tube (see Materials and Methods). Most of the cell nuclei lay within the progenitor domain (light-gray zone) at 26 hpf, whereas at 70 hpf they were mainly located in the neuronal differentiated domain (dark-gray zone). (J-J″) Immunostaining of Tg[4xGTIIC:Gal4;UAS:KAEDE] embryos using anti-HuC antibodies at 50 hpf, showing derivatives of Yap/Taz-active cells within the HuC-positive domain. Although cells within the neuronal domain are not active for Yap/Taz (as shown in Fig. 2), their derivatives can be tracked due to the stability of the KAEDE protein. Scale bars: 50 µm. |