
Fig. 4
- ID
- ZDB-FIG-190819-3
- Publication
- Cheung et al., 2019 - What makes a bad egg? Egg transcriptome reveals dysregulation of translational machinery and novel fertility genes important for fertilization
- Other Figures
- All Figure Page
- Back to All Figure Page
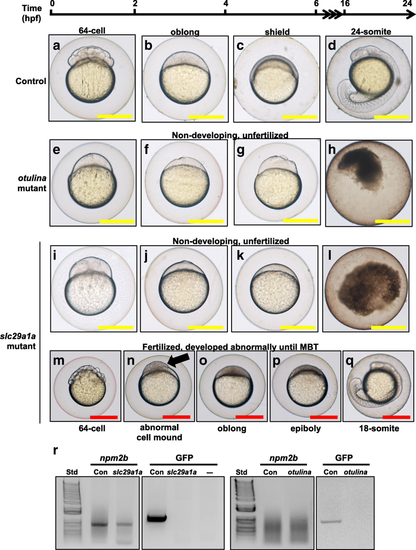
Representative images showing the development between 0 and 24 h post-fertilization (hpf) of F1 embryos from wildtype control (a-d), otulina-deficient (e-h), and slc29a1a-deficient (i-q) females. In the control eggs, the embryos were at 64-cell (A), oblong (b), shield (c), and 24-somite (d) stages according to Kimmel et al. [56]. Eggs from otulina and slc29a1a mutant females were non-developing and did not under any cell division (E-L). Some eggs from two slc29a1a mutant females were developing abnormally (M-Q). (a, e, i, m) = images taken at 2 hpf; (b, f, j, n) = images taken at 4 hpf; (c, g, k, o) = images taken at 6 hpf; (P) = image taken at 8 hpf; (d, h, l, q) = images taken at 24 hpf. The arrow demonstrates a partially cellularized blastodisc that was sitting atop an enlarged syncytium. Scale bars denote 500 μm. R: PCR genotyping for nucleoplasmin 2b (npm2b) and vasa:eGFP in spawned eggs from WT, otulina-, and slc29a1a-mutant females crossed with vasa:eGFP males to detect fertilization of the eggs. Std = 1 kb ladder; Con = WT female crossed with vasa:eGFP male
|
| Fish: | |
|---|---|
| Observed In: | |
| Stage Range: | 64-cell to 14-19 somites |