
FIGURE
Fig. 1
- ID
- ZDB-FIG-190814-31
- Publication
- McConnell et al., 2018 - Neural crest state activation in NRAS driven melanoma, but not in NRAS-driven melanocyte expansion
- Other Figures
- All Figure Page
- Back to All Figure Page
Fig. 1
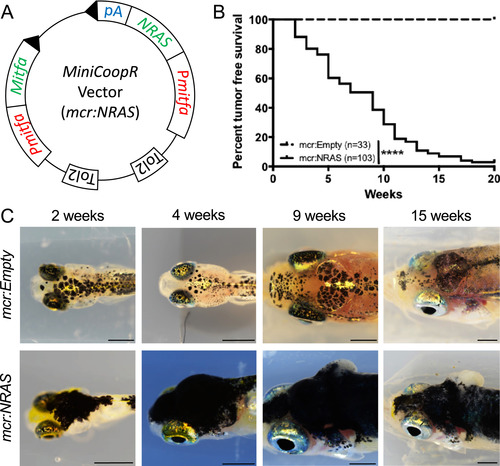
Zebrafish model of NRAS-driven melanoma. (A) Schematic of the MiniCoopR vector containing the NRASQ61R gene driven by the mitfa promoter (Pmitfa) in cis with the mitfa gene. (B) Kaplan-Meier curve showing the percent of casper;mcr:NRAS zebrafish without grossly apparently tumors compared to casper;mcr:Emptyfish. ****p < 0.0001 calculated using the log rank Mantel-Cox test. (C) Images of casper;mcr:NRAS and casper mcr:Empty fish taken at 2, 4, 9, and 15 weeks post fertilization. In contrast to the tumor formation seen in the casper;mcr:NRAS fish, normal melanocytepatterning is observed in casper;mcr:Empty controls. Scale bars represent 500 µm for 2 week images and 1000 µm for 4–15 week images. |
Expression Data
Expression Detail
Antibody Labeling
Phenotype Data
Phenotype Detail
Acknowledgments
This image is the copyrighted work of the attributed author or publisher, and
ZFIN has permission only to display this image to its users.
Additional permissions should be obtained from the applicable author or publisher of the image.
Reprinted from Developmental Biology, 449(2), McConnell, A.M., Mito, J.K., Ablain, J., Dang, M., Formichella, L., Fisher, D.E., Zon, L.I., Neural crest state activation in NRAS driven melanoma, but not in NRAS-driven melanocyte expansion, 107-114, Copyright (2018) with permission from Elsevier. Full text @ Dev. Biol.