
FIGURE
Fig. 4
Fig. 4
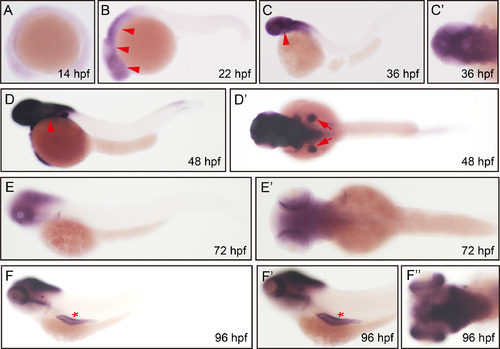
Whole mount in situ hybridization analysis of zebrafish aqp9a. (A) 14 hpf, lateral view, weak staining. (B) 22 hpf, overview of whole body, brain (arrowhead). (C) 36 hpf, overview of whole body, brain (arrowhead). (C′) 36 hpf, dorsal view, brain. (D) 48 hpf, overview of whole body, brain (arrowhead). (D′) 48 hpf, dorsal view, brain, pectoral fin (arrow). (E) 72 hpf, overview of whole body, brain. (E′) 72 hpf, dorsal view, brain. (F) 96 hpf, overview of whole body, brain, swim bladder (asterisk). (F′) 96 hpf, later view, brain, swim bladder (asterisk). (F″) 96 hpf, dorsal view, brain. |
Expression Data
| Gene: | |
|---|---|
| Fish: | |
| Anatomical Terms: | |
| Stage Range: | 10-13 somites to Day 4 |
Expression Detail
Antibody Labeling
Phenotype Data
Phenotype Detail
Acknowledgments
This image is the copyrighted work of the attributed author or publisher, and
ZFIN has permission only to display this image to its users.
Additional permissions should be obtained from the applicable author or publisher of the image.
Reprinted from Gene expression patterns : GEP, 32, Qin, Y., Wang, S., Duan, X., Liu, D., Expression analysis of the aquaporins during zebrafish embryonic development, 38-43, Copyright (2019) with permission from Elsevier. Full text @ Gene Expr. Patterns