
Fig. 1
- ID
- ZDB-FIG-190725-40
- Publication
- Santos-Pereira et al., 2019 - Pioneer and repressive functions of p63 during zebrafish embryonic ectoderm specification
- Other Figures
- All Figure Page
- Back to All Figure Page
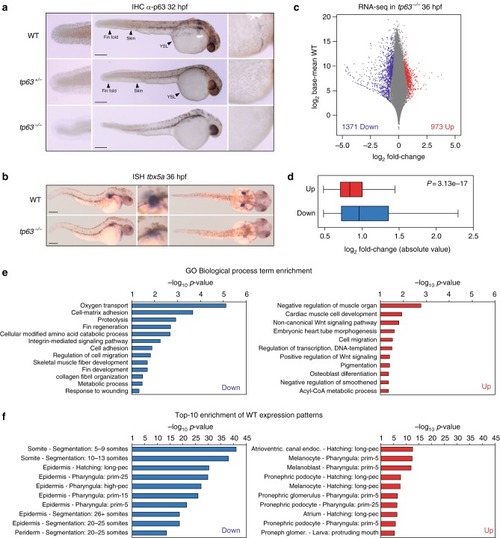
Zebrafish tp63−/− mutant embryos show de-regulated epidermal program. a Whole-mount embryo immunostaining of p63 in wild-type (WT), heterozygous tp63+/− and homozygous tp63−/− embryos at 32 h post fertilization (hpf) showing the absence of p63 expression in tp63−/− mutants. Left, zoomed lateral view of the tail; middle, lateral view of whole-embryo; right, zoomed lateral view of the yolk. YSL, yolk syncytial layer. b Whole-mount in situ hybridization of the tbx5a gene in WT and tp63−/−embryos at 36 hpf showing expression in eye, heart and pectoral fin bud, the latter one being reduced in tp63−/− mutant accordingly with the absence of this anatomical structure. Left, lateral view of whole embryo; middle, zoomed lateral view of the pectoral fin bud; right, dorsal view of whole embryo. For a and b, anterior is to the right. For a and b, scale bars represent 250 µm. c Differential analysis of gene expression between WT and tp63−/− at 36 hpf from RNA-seq (n = 3 biological replicates per condition). The log2 base mean WT transcript expression levels versus the log2 fold-change of expression are plotted. Transcripts showing a statistically significant differential expression (p < 0.05) are highlighted in red (upregulated) or blue (downregulated). d Box plot representing the absolute log2 fold-change of the up- (n = 973) and down-regulated (n = 1,371) transcripts from (c). Center line, median; box limits, upper and lower quartiles; whiskers, 1.5× interquartile range. p value according to the Wilcoxon’s rank sum test is shown. Source data are provided as a Source Data file. e Gene Ontology (GO) Biological Process term enrichment of the genes corresponding to the up- and down-regulated transcripts from (c). f Top-10 enrichment of WT expression patterns of the genes corresponding to the up- and down-regulated transcripts from (c). For e and f, the -log10 of p-value for each term is shown
|
| Gene: | |
|---|---|
| Antibody: | |
| Fish: | |
| Anatomical Term: | |
| Stage Range: | Prim-15 to Prim-25 |
| Fish: | |
|---|---|
| Observed In: | |
| Stage Range: | Prim-15 to Prim-25 |