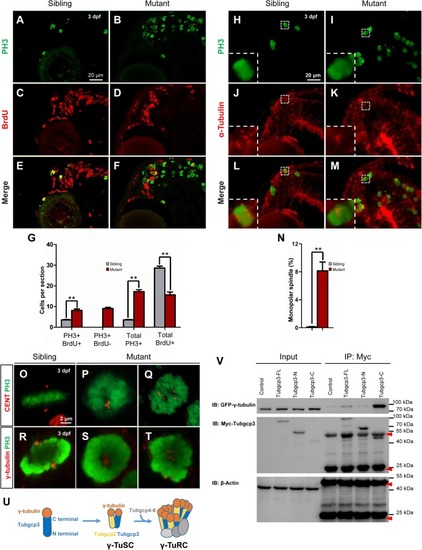
The tubgcp3 mutant CMZ cells arrest in M-phase showing monopolar spindles and abnormal distributed centrioles and γ-tubulin. (A–F) Immunostaining analysis of cell proliferation in zebrafish retina at 3 dpf using DNA replication marker (BrdU, red) and mitotic marker (PH3, green). Embryos are incubated with BrdU for 6 h before being collected at 72 hpf for the analysis. Almost all cells in wild-type sibling CMZ are BrdU+ with several PH3+ cells among them (A,C,E). In the (tubgcp3 mutant retina, PH3+ cells are significantly increased (B,F), but BrdU+ cells are markedly decreased (D,F). Note that PH3+ BrdU- cells are detected in the tubgcp3 mutant retina (F) but absent in the wild-type sibling (E). (G)Bar chart analyses depicting quantification of BrdU- and PH3-labeled cells in wild-type sibling and tubgcp3 mutant retinae. Data are mean + SEM from 50 retinal sections for each group. Student’s t-test: ∗∗P < 0.01. (H–M) Immunostaining of 3 dpf retinal cryosections with anti-α-tubulin (red) and anti-PH3 (green) displaying bipolar spindles formed in mitotic cells in wild-type siblings (H,J,L). In the tubgcp3 mutant retina, many mitotic RPCs exhibit monopolar spindles (I,K,M). Insets indicate high-magnification images of mitotic RPCs in rectangles in (H–M). (N) Bar charts depicting quantification of mitotic cells with monopolar spindles in wild-type sibling (0.12 per section, n = 43 sections) and the tubgcp3 mutant retinae (8.14 per section, n = 36 sections). (O–Q)Immunostaining analyses displaying a pair of centrioles at each pole of the bipolar spindle in mitotic cells in wild-type sibling CMZ (O). In the tubgcp3 mutant retinae, centrioles are distributed at the center of the M-phase arrested cells (57.6%, n = 59 M-phase arrested cells) (P) or randomly scatter in these cells (42.4%, n = 59 M-phase arrested cells) (Q). (R–T) Immunostaining analyses exhibiting γ-tubulin at the spindle poles in mitotic cells in wild-type sibling (R). In tubgcp3 mutant retinae, γ-tubulin localizes at the center of the M-phase arrested cells, showing a single focus (62.5%, n = 80 M-phase arrested cells) (S) or scattered foci (37.5%, n = 80 M-phase arrested cells) (T). (U) Schematic representation of the structure of γ-TuSC and γ-TuRC. (V) Co-immunoprecipitation (IP) assays showing Tubgcp3 interacts with γ-tubulin through its C terminal domain. HEK293T cells were transfected with plasmids to express GFP-tagged zebrafish γ-tubulin and Myc-tagged zebrafish Tubgcp3 fragments, including full length (1–906 aa) Tubgcp3, N terminal (1–551 aa) Tubgcp3 and C terminal (552–906 aa) Tubgcp3. Then the cell samples were performed by immunoprecipitation with anti-Myc antibody and analyzed by immunoblotting (IB) with anti-Myc and anti-GFP antibodies. β-Actin was used as the loading control. Arrowheads indicate the IgG heavy chain (∼50 kDa) and IgG light chain (∼25 kDa). Scale bars: 20 μm (A–F); 20 μm (H–M); 2 μm (O–T).
|
