
Figure 2
- ID
- ZDB-FIG-190723-734
- Publication
- van den Berg et al., 2019 - Proteolytic and Opportunistic Breaching of the Basement Membrane Zone by Immune Cells during Tumor Initiation
- Other Figures
- All Figure Page
- Back to All Figure Page
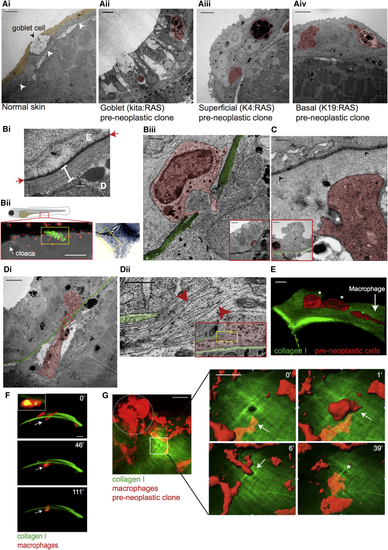
Correlative Light and Electron Microscopy of Immune Cells Entering the Epidermis (Ai) Transmission electron microscopy (TEM) of 5 dpf WT larval skin; superficial epidermal layer (sepia), basal layer beneath, and the basement membrane, visible as a thin dark line (arrowheads) and goblet cell. (ii) TEM of kita:RAS clone (16 dpf), and superficial (iii) and basal (iv) clones in 5 dpf (72 hpi) larvae, shows immune cells (false colored red) within the clones. (Bi) TEM of larval BMZ. Red arrows indicate the basement membrane; the white bar indicates collagen I, E is the epidermis above, and D is the dermis below the BMZ. (ii and iii) CLEM; confocal image (ii, lower left) and methylene blue-stained section (ii, right) show where clone and immune cell interactions take place (yellow boxes) near the cloaca (arrow in ii). (iii) Granulocyte (red) in a breach in the BMZ (green) beneath a goblet cell clone (see inset) in 10 dpf larva. (C) Neutrophil (red) protrusions surrounding bundled collagen I (asterisk) below the BM (arrowheads) beneath a pre-neoplastic superficial cell clone (in inset BM zone is colored in green) in 5 dpf (72 hpi) larva. (Di) A macrophage (red), containing collagen, spans a breach in the BM (green) beneath a basal cell clone in 5 dpf (72 hpi) larva. (ii) High-magnification view corresponding to yellow box in red inset, which, in turn, corresponds to red box in (i). Red arrowheads indicate collagen fibrils. (E) Confocal imaging of a 5 dpf/48 hpi larva shows a macrophage (red, see white arrow) above the collagen I layer (green) approaching two pre-neoplastic basal cells (red, see white asterisks). (F) Confocal imaging of a macrophage (white arrows) containing engulfed collagen (yellow) in the collagen I-GFP layer in 5 dpf (48 hpi) larva. Inset: a single z stack shows collagen I-GFP (yellow) within the macrophage. (G) Stills from a time-lapse video (minutes in top right corner) show a macrophage (red) squeezing through a pre-existing hole in the collagen I layer (green) beside a superficial pre-neoplastic clone on the left (red, dotted white circle) in 5 dpf (72 hpi) larva. See also Scale bars: 5 μm (Ai–Aiv, Biii and C [insets], Di, and G [video stills]); 500 nm (C); 100 nm (Dii); 1 μm (Dii [inset] and Biii); 10 μm (E and F); 20 μm (G); 500 nm (Bi); and 100 μm (Bii). |