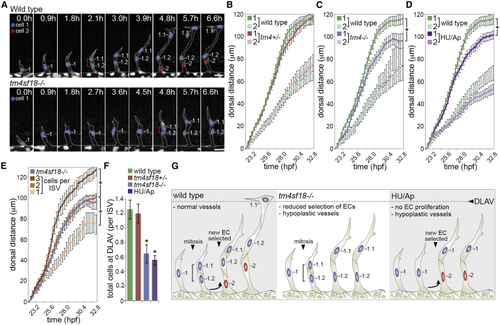
FIGURE

Figure 6

ID
ZDB-FIG-190723-438
Publication
Page et al., 2019 - Positive Feedback Defines the Timing, Magnitude, and Robustness of Angiogenesis
Other Figures
All Figure Page
Back to All Figure Page
Figure 6

Hypocellular Vessels in tm4sf18−/− Mutants Fail to Extend Appropriately

(A) Time-lapse images of sprouting ISVs in WT and tm4sf18−/−Tg(kdrl:nlsEGFP)zf109 embryos from 19 hpf. Brackets indicate dividing cells. Nuclei are pseudocolored. ISVs appear shorter in the absence of tm4sf18.

(B–D) Quantification of the dorsal movement of tip (cell 1) or stalk (cell 2) ECs in WT and tm4sf18+/− (B), tm4sf18−/− (C), or HU/Ap-treated (D) embryos (n = 71 ISVs from 16 WT, 69 ISVs from 15 tm4sf18+/−, 39 ISVs from 8 tm4sf18−/−, and 89 ISVs from 22 HU/Ap-treated embryos).

(E) Quantification of the dorsal movement of tip ECs in non-proliferating ISVs consisting of 1, 2, and 3 or more ECs and comparison with the motility of tip ECs in tm4sf18−/− embryos (n = 39 ISVs from 8 tm4sf18−/− embryos, as well as 17 ISVs with 3 cells, 53 ISVs with 2 cells, and 16 ISVs with 1 cell from 22 embryos).

(F) Quantification of the number of ECs that reach the DLAV position in WT, tm4sf18+/−, tm4sf18−/−, and HU/Ap-treated embryos (n = 63 ISVs from 16 WT, 56 ISVs from 15 tm4sf18+/−, 31 ISVs from 8 tm4sf18−/−, and 86 ISVs from 22 HU/Ap-treated embryos).

(G) Illustration of the causes of vessel hypoplasia and phenotypic effect on vessel extension.

Data are means ± SEM. p < 0.05, two-way ANOVA or two-tailed t test. Scale bars, 25 μm.

See also Figure S4.

Expression Data

Expression Detail
Antibody Labeling
Phenotype Data

Phenotype Detail
Acknowledgments
This image is the copyrighted work of the attributed author or publisher, and ZFIN has permission only to display this image to its users. Additional permissions should be obtained from the applicable author or publisher of the image. Full text @ Cell Rep.