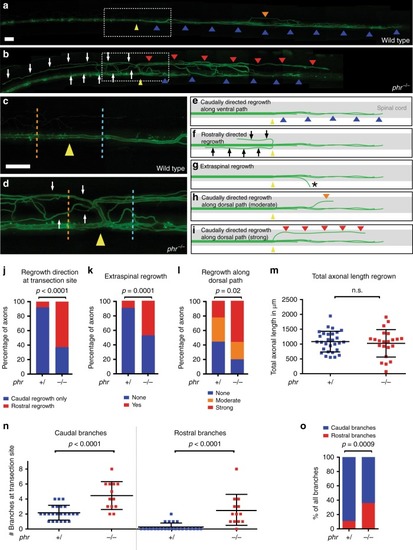
PHR promotes directional regrowth of Mauthner axons. a–d Mauthner axon at 48 hpt; stitched, low magnification images of a wild type (a), and a phr mutant axon (b). Higher magnification of boxed areas (a, b) shown in c (wild type) and d (phr mutant). Yellow arrowheads mark the transection sites; white arrows mark rostrally directed projections in phr mutant. Caudally directed regrowth either labeled by blue arrowheads (along ventral spinal cord), orange arrowhead (moderate misdirected regrowth along dorsal spinal cord) or red arrowheads (strong misdirected regrowth along dorsal spinal cord). All Scale bars: 30 µm. e–i Schematic representation of Mauthner axonal regrowth: Caudally directed regrowth along ventral spinal cord (blue arrowheads; e), rostrally misdirected regrowth (black arrows; f), extraspinal regrowth (asterisk in g; see also Fig. 2f) or caudally misdirected regrowth along dorsal spinal cord (red/orange arrowheads; h, i). Quantification of regrowth direction at the transection site (j). Axons regrown exclusively in the caudal direction (blue bar); axons showing additional or exclusive rostrally directed regrowth (red bar) in phr mutants (n = 37) and nonmutant siblings (n = 27). Quantification of extraspinal ventral regrowth (k). Quantification of caudally directed regrowth along dorsal spinal cord (l) using a three-category rubric of “no”, “moderate” or “strong” misdirected regrowth along dorsal spinal cord (see also e, h, i); p-values determined by Fisher exact tests (j–l). N = 21 phr mutants and n = 30 nonmutant siblings were analyzed (k, l). Quantification of total length of regrown axons (sum of rostral and caudal regrowth; in n = 22 phr mutants and n = 29 nonmutant siblings with p-values determined using two-tailed Student’s t-test (m). Absolute number of rostral and caudal branches per axon in phr mutants (n = 13) and nonmutant siblings (n = 23), 40 µm rostral (orange dotted line; c, d), and 40 µm caudal (blue dotted line; c, d) to the transection site (n). Compared to nonnmutant siblings, caudally directed branches were increased twofold and rostrally directed branches were increased more than ninefold in phr mutants, (n); resulting in a higher percentage of rostrally directed branches in regrown phr mutant axons (o). P-values were determined using two-tailed Student’s t-test (N, caudal), Mann–Whitney test (N, rostral) or Fisher exact test (o)
|
