
FIGURE
Figure 6—figure supplement 1.
- ID
- ZDB-FIG-190723-2690
- Publication
- Jiang et al., 2019 - A conserved morphogenetic mechanism for epidermal ensheathment of nociceptive sensory neurites
- Other Figures
-
- Fig. 1
- Fig. 1-S1
- Fig. 1-S2
- fig2
- fig3
- Figure 2—figure supplement 1.
- Figure 3—figure supplement 1.
- Figure 4
- Figure 4—figure supplement 1.
- Figure 4—figure supplement 2.
- Figure 4—figure supplement 3.
- Figure 5
- Figure 5—figure supplement 1.
- Figure 5—figure supplement 2.
- Figure 5—figure supplement 3.
- Figure 6
- Figure 6—figure supplement 1.
- Figure 6—figure supplement 3.
- Figure 7—figure supplement 1.
- All Figure Page
- Back to All Figure Page
Figure 6—figure supplement 1.
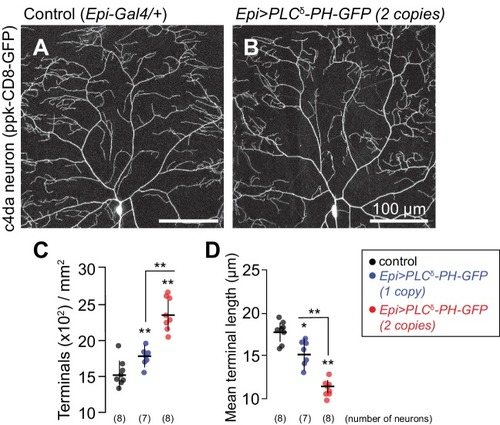
Representative images of 120 h AEL c4da neurons from ( |
Expression Data
Expression Detail
Antibody Labeling
Phenotype Data
Phenotype Detail
Acknowledgments
This image is the copyrighted work of the attributed author or publisher, and
ZFIN has permission only to display this image to its users.
Additional permissions should be obtained from the applicable author or publisher of the image.
Full text @ Elife