FIGURE

Figure 2

ID
ZDB-FIG-190723-2272
Publication
Moore et al., 2012 - Through the Looking Glass: Visualizing Leukemia Growth, Migration, and Engraftment Using Fluorescent Transgenic Zebrafish
Other Figures
All Figure Page
Back to All Figure Page
Figure 2

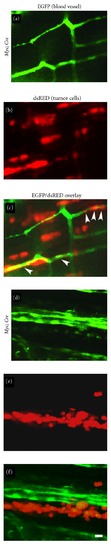
Zebrafish T-lymphoblasts overexpressing bcl2 spread locally but fail to intravasate into vasculature. (a)–(c) dsRED2-expressing lymphoma cells (b) from the Myc; Cre fish intravasate into EGFP-labeled vasculature (a) of the transplant host Tg(fli1:EGFP); Casper by 6 days posttransplantation (see arrowheads in (c)). (d)–(f) In contrast, dsRED2-expressing lymphoma cells (e) from the Myc; Cre; bcl2 fish fail to intravasate vasculature (d) of the transplant hosts by 6 days posttransplantation (compare (f) with (c)). Note aggregates of the Myc; Cre; bcl2 lymphoma cells in (e) and (f). Scale bar is 10 μm. Reprinted from [10].

Expression Data

Expression Detail
Antibody Labeling
Phenotype Data

Phenotype Detail
Acknowledgments
This image is the copyrighted work of the attributed author or publisher, and ZFIN has permission only to display this image to its users. Additional permissions should be obtained from the applicable author or publisher of the image. Full text @ Adv. Hematol.