FIGURE

Figure 3

ID
ZDB-FIG-190723-2266
Publication
de Jong et al., 2012 - Histocompatibility and Hematopoietic Transplantation in the Zebrafish
Other Figures
All Figure Page
Back to All Figure Page
Figure 3

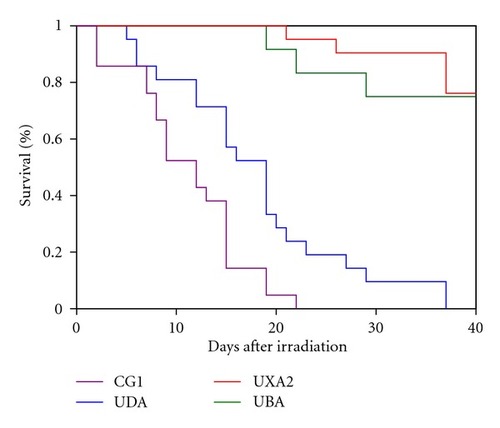
Survival of different zebrafish lines in response to radiation. Kaplan-Meier survival curves are shown for four different zebrafish strains after irradiation with a total dose of 25 Gy, delivered in two equal fractions of 12.5 Gy separated by 24 hours. Twenty one fish were irradiated in each group. CG1 is a clonal homozygous diploid fish line generated by parthenogenesis [21, 38]. UDA, UXA2, and UBA are inbred zebrafish lines derived from a single mating pair of AB parents [35]. Each line was named for the homozygous class I MHC gene at its chromosome 19 locus. The results demonstrate 100% mortality for the CG1 fish by day 22, and by day 37 for the UDA fish. In contrast, the UBA and UXA2 fish lines both had approximately 80% survival at 40 days after irradiation.

Expression Data

Expression Detail
Antibody Labeling
Phenotype Data

Phenotype Detail
Acknowledgments
This image is the copyrighted work of the attributed author or publisher, and ZFIN has permission only to display this image to its users. Additional permissions should be obtained from the applicable author or publisher of the image. Full text @ Adv. Hematol.