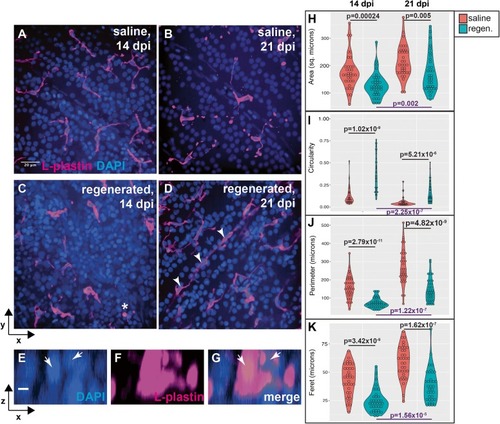
Morphological features of microglia in ganglion cell layer of histologically regenerated retinas. A–D Images show L-plastin+ microglia (magenta) in the ganglion cell layer (GCL) of saline injected (A and B) or histologically regenerated retinas at 14 or 21 dpi ouabain (C and D). Microglia in saline injected retinas appear ramified, displaying long complex processes with multiple tips (A and B). Microglia in regenerated retinas at 14 dpi appear rounded (ameboid) in shape and have few processes (C). In regenerated retinas at 21 dpi, microglia remain more ameboid than those seen in saline injected controls; however, some microglia begin to display more cellular processes (D). Microglia in regenerated retinas are occasionally associated with multiple nuclei (asterisk, C, resliced projections E–G). Chains of rod-shaped microglia are observed in regenerated retinas (D, arrowheads). E–G Individual channels in resliced projections of the microglia denoted by a asterisk in (C). Arrows indicate DAPI+ nuclei. H–K Violin plots show distributions of area (H), circularity (I), perimeter (J), and Feret diameter (K) of individually traced microglia located in the GCL at 14 and 21 dpi following injection of saline (red plots) or ouabain (regenerated, teal plots). Violin shapes show distribution of all measurements; circles within violin plots represent individual microglia. Area is reported in square microns; circularity as a value from 0 to 1.0 (1.0 indicating perfect circle); perimeter and Feret’s diameter are reported in microns. More information on morphological parameters/measurements is located in the “Methods” section. Indicated p values (two-tailed Student’s t test) in black compare measurements from regenerated to saline injected at the same time point; p values in purple (bottom of graphs) compare measurements from 21 to 14 dpi ouabain. Scale bar in A (applies to A–D) = 20 μm; scale bar in E (applies to E–G) = 5 μm
|
