FIGURE

Figure 4

ID
ZDB-FIG-190723-1783
Publication
Le et al., 2011 - Conserved Regulation of p53 Network Dosage by MicroRNA-125b Occurs through Evolving miRNA-Target Gene Pairs
Other Figures
All Figure Page
Back to All Figure Page
Figure 4

Validation of miR-125b targets.

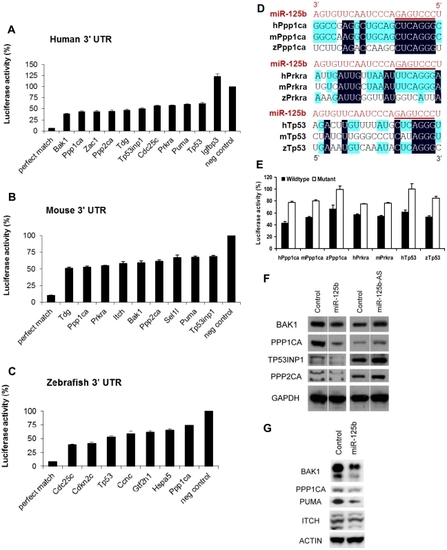
Candidate p53 network genes that were positive in both the GOF/LOF screen and miR-125b pull-down were validated for targeting by miR-125b using the 3′ UTR luciferase reporter assay and Western blots for protein expression. (A-C), Reporter genes containing the full-length 3′ UTRs of each selected target gene were co-transfected with miR-125b duplex into 293T cells. Luciferase readings were obtained 48 hours after transfection and presented here as the average percentage of luciferase activity ± s.e.m. (n≥3) relative to a scrambled duplex co-transfected control (100%). A reporter containing a 23-nucleotide-binding-site with perfect complementarity to miR-125b was used as the perfect match positive control, while the unmodified luciferase reporter was used as the empty negative control. (A) Human: 10 out of 13 candidate genes' 3′ UTRs showed significant repression by miR-125b relative to the control (p<0.01). (B) Mouse: 9 out of 11 candidate genes' 3′ UTRs showed significant repression by miR-125b relative to the control (p<0.01). (C) Zebrafish: 7 out of 8 candidate genes' 3′ UTRs showed significant repression by miR-125b relative to the control (p<0.01). (D) Alignment of predicted miR-125b binding sites in the 3′UTRs of Ppp1ca, Prkra and Tp53 across three species. Seed-binding sequences are underlined. Bases conserved in two (blue) or three (black) species are highlighted. (E) The 3′UTR seed-binding sequences of 7 target mRNAs were mutated and assayed for direct binding to miR-125b using the luciferase reporter assay, relative to wild-type 3′UTR sequences. (E) The seed-binding sequences in the 3′UTR of 7 predicted target mRNAs were mutated and compared to wild-type sequences for binding to miR-125b using luciferase reporter assay. (F-G) Western blot analysis of protein expression of selected target genes two days after a transfection of miR-125b duplex, miR-125b antisense (AS) or negative control duplex or negative control antisense. (F) Western blots showed that miR-125b repressed BAK1, PPP1CA, TP53, and PPP2CA levels in human SH-SY5Y neuroblastoma cells, while the antisense RNA miR-125b-AS derepressed expression of these proteins in human ReNcell VM neural progenitor cells. (G) Western blots showed that miR-125b repressed BAK1, PPP1CA, PUMA, and ITCH levels in mouse N2A neuroblastoma cells. Abbreviations: h, human; m, mouse; z, zebrafish.

Expression Data

Expression Detail
Antibody Labeling
Phenotype Data

Phenotype Detail
Acknowledgments
This image is the copyrighted work of the attributed author or publisher, and ZFIN has permission only to display this image to its users. Additional permissions should be obtained from the applicable author or publisher of the image. Full text @ PLoS Genet.