FIGURE

Figure 9.

ID
ZDB-FIG-190723-1755
Publication
Chen et al., 2019 - Deletion of Gtpbp3 in zebrafish revealed the hypertrophic cardiomyopathy manifested by aberrant mitochondrial tRNA metabolism
Other Figures
All Figure Page
Back to All Figure Page
Figure 9.

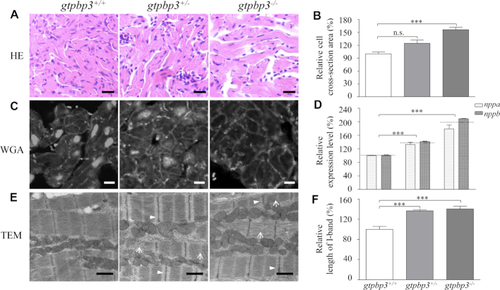
Hypertrophic cardiomyopathy in zebrafish. (A) Hematoxylin and eosin stained (H&E) histological sections of hearts from gtpbp3−/−, gtpbp3+/− and gtpbp3+/+ zebrafish at the age of one year. Scale bars: 10 μm. (B) The relative cross-sectional area of cardiomyocyte in gtpbp3+/+ (n = 136), gtpbp3+/- (n = 147), gtpbp3−/− (n = 116) zebrafish, staining with H&E. (C) The cardiomyocytes from mutant and WT zebrafish were visualized via WGA staining. Scale bars: 5 μm. (D) Relative levels of nppa and nppb gene in hearts from mutant and WT zebrafish. (E) Ventricular heart muscle sections of transmission electron microscopy in mutant and WT zebrafish. Ultrathin sections were visualized with 15,000X magnifications. Altered myofibrils were indicated by white arrows and widened I-band in the sarcomere units were indicated by white arrowhead. Scale bars: 1 μm. (F) Quantification of the I-band length of gtpbp3+/+ (n = 16), gtpbp3+/- (n = 38) and gtpbp3−/− (n = 37) zebrafish. The values for the mutants were expressed as percentages of the average values for the wild type.

Expression Data

Expression Detail
Antibody Labeling
Phenotype Data

Phenotype Detail
Acknowledgments
This image is the copyrighted work of the attributed author or publisher, and ZFIN has permission only to display this image to its users. Additional permissions should be obtained from the applicable author or publisher of the image. Full text @ Nucleic Acids Res.