|
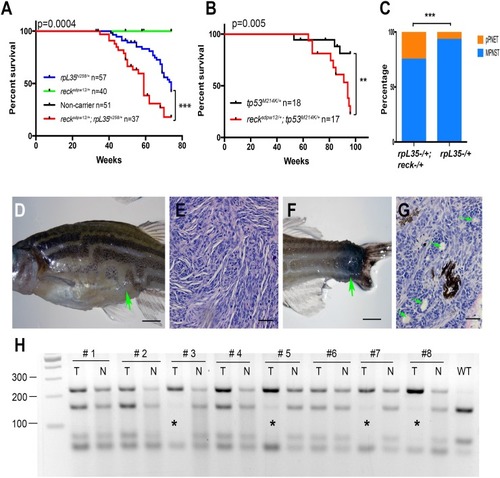
<italic>Reck</italic> is a tumor suppressor gene in zebrafish MPNSTs(A–B) Loss of the reck gene function facilitates tumorigenesis in either rp or tp53 mutant background. Kaplan–Meier curves showing tumor-free survival of cohorts of single and double heterozygotes derived from rpL35hi258/+ x sdpw12/+ crosses (A) and tp53M214K/+ x sdpw12/+ crosses (B). Fish from all crosses were genotyped by PCR for each relevant mutation at 6–8 weeks of age, and housed segregated by genotype. In all panels, the numbers of fish (n) of each genotype are shown next to the genotype. The p values between the rp or tp53 single heterozygote and the compound mutants are shown in the figures. The green line (sdpw12/+) and black line (non-carrier) are overlapped in panel (A). (C) More zebrafish developed pPNETs in the rpL35hi258/+;sdpw12/+ compared to rpL35hi258/+. Two-tailed fisher's exact test was used for statistical analysis. p = 0.008. Asterisks indicate statistical significance (A–C). (D) A typical zebrafish with abdominal MNPST. The green arrow indicates the position of the tumor. (E) Hematoxylin and Eosin (H&E) staining showed typical histopathology of zebrafish MPNST, which is characterized by interlacing bundles and swirls of spindle shaped tumor cells. (F) A typical pPNET that was found in the tail region. The green arrow indicates the position of the tumor. (G) Representative examples of pPNET histology by H&E staining. The pseudorosettes (Flexner-Wintersteiner rosettes) are indicated with green arrows. (H) The wildtype allele is lost in some of the tp53M214K/+;sdpw12/+ tumors (tumor samples are labeled with asterisks). The reck gene was amplified by PCR using primers flanking the sdpw12 mutation site. The PCR product was then digested with Ava II, which only cuts the 233bps wildtype PCR product into 158bps and 75bps fragments [34]. T, tumor; N, normal tissue from caudal fin. Note, the lowest band is from the PCR primer polymerization. Scaler bar = 250 mm (D, F) Scale bar = 50 mm (E, G).
|