|
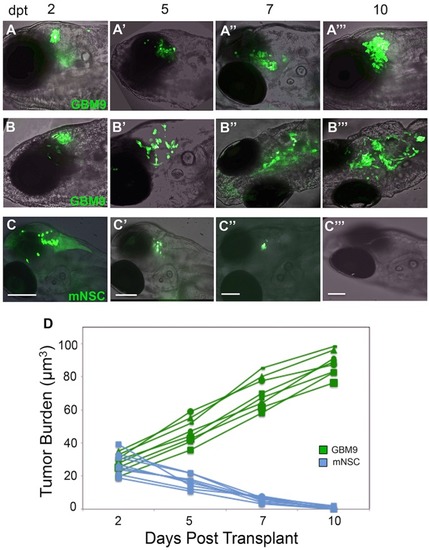
Analysis of tumor burden in live animals over time. Confocal images superimposed on bright field (anterior to the left) of two representative casper zebrafish transplanted with 50-75 GBM9 cells (A-A‴,B-B‴) and a casper animal transplanted with control mNSC cells (C-C‴) imaged at 2 (A,B,C), 5 (A′,B′,C′), 7 (A″,B″,C″) and 10 (A‴,B‴,C‴) dpt. Examples of a compact (A-A‴) and diffuse tumor (B-B‴) are shown. (D) Tumor burden were quantified using volume measurements of florescence in micrometers cubed. Approximately 50-75 GBM9 cells (green lines) and ∼50 mNSC cells (blue lines) were transplanted and followed over time in the same animal. n=8 animals per group. Scale bars: 100 μm.
|