
Fig. 5
- ID
- ZDB-FIG-190723-1539
- Publication
- Jin et al., 2019 - Dysregulation of Microglial Function Contributes to Neuronal Impairment in Mcoln1a-Deficient Zebrafish
- Other Figures
- All Figure Page
- Back to All Figure Page
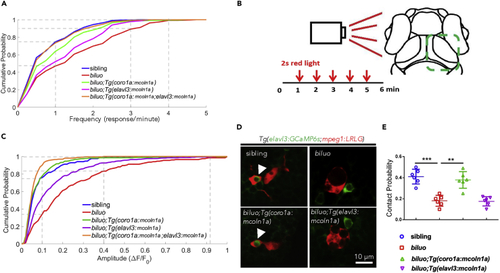
Optic Tectal Neurons in biluo Mutants Exhibit Excessive Spontaneous and Visual-Evoked Activities (A) Distribution of frequency of spontaneous responses of the tectal neurons in sibling, biluo, biluo;Tg(coro1a:mcoln1a), biluo;Tg(elavl3:mcoln1a), and biluo;Tg(coro1a:mcoln1a;elavl3:mcoln1a). n(sibling) = 214 cells in 4 embryos, n(biluo) = 166 cells in 4 embryos, n(biluo;Tg(coro1a:mcoln1)) = 165 cells in 4 embryos, n(biluo;Tg(elavl3:mcoln1a)) = 221 cells in 5 embryos and n(biluo;Tg(coro1a:mcoln1a;elavl3:mcoln1a)) = 225 cells in 4 embryos. P(sibling vs biluo) = 4.6 × 10⁻¹³, P(biluo vs biluo;Tg(coro1a:mcoln1a)) = 9.4 × 10⁻⁶, P(biluo vs biluo;Tg(elavl3:mcoln1a)) = 0.0017, and P(biluo vs biluo;Tg(coro1a:mcoln1a;elavl3:mcoln1a)) = 5.7 × 10⁻¹⁰. (B) Schematic of recording visual-evoked responses of optic tectal neurons in 6-dpf embryos. Red light flashed was given to the left eye of the embryos at 1, 2, 3, 4, and 5 min, and the duration of each stimulus was 2 s. The neuronal responses of the right half tectum were recorded. (C) Distribution of average peak of ΔF/F0 in sibling, biluo, biluo;Tg(coro1a:mcoln1a), biluo;Tg(elavl3:mcoln1a), and biluo;Tg(coro1a:mcoln1;elavl3:mcoln1). n(sibling) = 203 cells in 4 embryos, n(biluo) = 263 cells in 4 embryos, n (biluo;Tg(coro1a:mcoln1a)) = 305 cells in 4 embryos, n(biluo;Tg(elavl3:mcoln1a)) = 364 cells in 5 embryos, n(biluo;Tg(coro1a:mcoln1a;elavl3:mcoln1a)) = 280 cells in 4 embryos. P(sibling vs biluo) = 4.9 × 10⁻¹⁷, P(biluo vs biluo;Tg(coro1a:mcoln1a)) = 4.7 × 10⁻²², P(biluo vs biluo;Tg(elavl3:mcoln1a)) = 4.2 × 10⁻⁶, P(biluo vs biluo;Tg(coro1a:mcoln1a;elavl3:mcoln1a)) = 3.2 × 10⁻³⁴, and P(biluo;Tg(coro1a:mcoln1a) vs biluo;Tg(elavl3:mcoln1a)) = 2.1 × 10⁻¹¹. (D) Representative images of neuron (green)-microglia contact in 5-dpf sibling, biluo, biluo;Tg(coro1a:mcoln1a), and biluo;Tg(elavl3:mcoln1a) embryos. (E) Quantification of contact probability between microglia and optic tectal neurons. Contact duration longer than 24 s is recognized as a functional microglia-neuron contact. n(sibling) = 9 embryos, n(biluo) = 10 embryos, n (biluo;Tg(coro1a:mcoln1a)) = 9 embryos, n (biluo;Tg(elavl3:mcoln1a)) = 8 embryos. ***p < 0.0001, **p < 0.001, ANOVA. Error bars represent mean ± SD. |
| Fish: | |
|---|---|
| Observed In: | |
| Stage Range: | Day 5 to Day 6 |