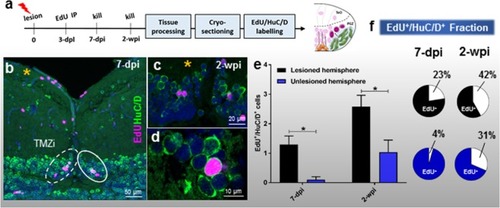
Differentiation post-lesion in NE amplifying progenitors in the TMZi. (a) Experimental design to investigate the time course of differentiation of NE amplifying progenitors to newborn neurons at 7-dpi and 2-wpi. (b) Image displaying the tectal midline showing the TMZi of lesioned (yellow asterisk; white dashed circle) and unlesioned (solid circle) hemispheres at 7-dpi. (c,d) High magnification examples showing co-labelling of EdU+/HuC/D+ cells adjacent the TMZi at 2-wpi. (e) Number of EdU+/HuC/D+ cells between the lesioned and unlesioned hemispheres at 7-dpi and 2-wpi of EdU (unpaired t-test, two-tailed: 7-dpi lesion vs 7-dpi unlesioned, p = 0.0083; 2-wpi lesion vs 2-wpi unlesioned, p = 0.0336). (f) Fraction of EdU+/HuC/D+ cells as a percentage of the total EdU+ population in the PGZ across chase times post-lesion. Experimental replicates were combined for all statistical analyses. All data presented are mean ± S.E.M. Significance was accepted at *p < 0.05. In panels b-d, DAPI nuclear counterstaining (blue) was performed. In all cross-sectional images dorsal is oriented up. TMZi, internal tectal marginal zone; dpl, days post lesion; dpi, days post EdU injection; wpi, weeks post EdU injection.
|
