FIGURE

Figure 3

ID
ZDB-FIG-190723-1339
Publication
Leung et al., 2018 - Integrating Functional Analysis in the Next-Generation Sequencing Diagnostic Pipeline of RASopathies
Other Figures
All Figure Page
Back to All Figure Page
Figure 3

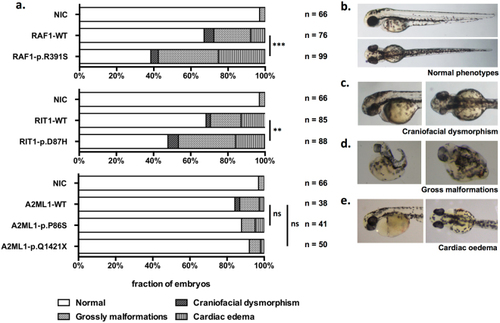
Transient expression of RNA transcripts in zebrafish embryos. The injection dosage of each RNA transcript was optimised for comparison (RAF1: 50 pg/embryo; RIT1: 400 pg/embryo; A2ML1: 200 pg/embryo). A morphometric analysis was performed to compare the effect of the VUSs compared to the wild-type transcript at three dpf. Statistical significance was derived using a two-sided Fisher’s exact test to compare mutants with the corresponding WT. **p < 0.01; ***p < 0.001; ns: not significant. NIC: No injection control; (a) Proportion of zebrafish embryos with normal or diseased phenotypes. (b) Representative zebrafish embryos with a normal phenotype (c) craniofacial dysmorphism (d) gross malformations and (e) cardiac oedema.

Expression Data

Expression Detail
Antibody Labeling
Phenotype Data

Phenotype Detail
Acknowledgments
This image is the copyrighted work of the attributed author or publisher, and ZFIN has permission only to display this image to its users. Additional permissions should be obtained from the applicable author or publisher of the image. Full text @ Sci. Rep.