
Figure 2
- ID
- ZDB-FIG-190723-111
- Publication
- Winter et al., 2018 - Author Correction: 4-dimensional functional profiling in the convulsant-treated larval zebrafish brain
- Other Figures
- All Figure Page
- Back to All Figure Page
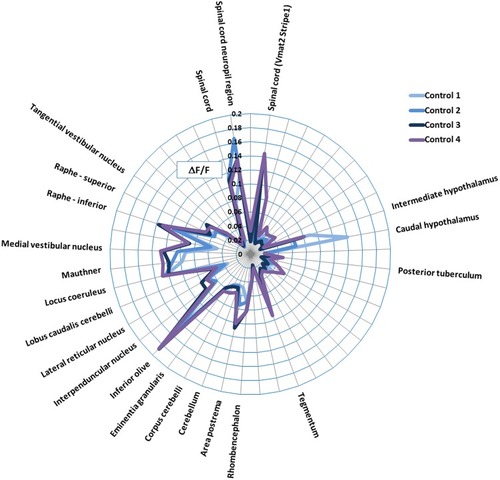
Summary of the control fish data across 4 experiments. Data are shown as the average of DF/F (=(F1−F0)/F0*100, where F1 = peak fluorescence intensity, and F0 = baseline fluorescence intensity) of the fish within each control group. Only those regions showing activity greater than the median of all areas (>0.0386) are labelled. Note the consistency in brain regions showing measurable baseline activity. In particular, activity was most pronounced in the hypothalamus, tegmentum, rhombencephalon, inferior olive, locus coeruleus, mauthner cells, medial vestibular nucleus, superior and inferior raphe, spinal cord neuropil region and spinal cord Vmat2 Stripe1. |